This is a common issue for many organizations, big and small, but it’s not an impossible one to solve!
If you’re experiencing a similar situation, you need to invest in gathering persona data that will not only tell you who your customers are and what they care about, but why they care and how they expect brands to make them feel.
To get started, let’s define each set of data, how it’s gathered and what it’s used for.
What is qualitative data?
Qualitative data – or primary data – is commonly gathered by businesses and plays an important role in understanding target audience sentiment and informing customer journey design. By conducting unstructured or semi-structured first-person user interviews, discussions, on-site observations, in-house moderated user testing, web analytics, and focus groups, qualitative data-collecting techniques allow companies to interact directly with their key customers, see how they’re using their products or services and receive feedback in real-time. It helps define the customer journey and establish an initial foundation and understanding of all internal and external customer experiences.
There’s just one problem: Sometimes people don’t know what they want, don’t have the words to truly express how they feel, or simply, aren’t honest.
That’s when quantitative data comes in.
Quantitative data enhances primary research and design efforts by quantifying key problem areas.
What is quantitative data?
Quantitative data – which can be gathered through a variety of structured surveys, questionnaires, and polls – is essential secondary research. When transformed into statistics, it enhances primary research (qualitative data) and design efforts by quantifying key problem areas. It also allows marketers, developers, business leaders and customer experience drivers to peer into customer details, attitudes, and behaviors from a data-driven standpoint, and test hypotheses established from qualitative data.
Qualitative Data vs. Quantitative Data: When Should You Use Each & How?
Let’s start with the when. To craft the best customer experiences, companies should collect and analyze both data sources on an ongoing basis. Because – and this is a big one – audiences and their expectations are always changing. By executing primary and secondary research to gather qualitative and quantitative data, companies make themselves better equipped to not only identify, but truly understand their customer base – how they interact, experience, and feel about a website, application or overall brand.
And don’t forget to gather employee input, as well! Employees are often the first to know what’s working and what’s not. Most organizations shy away from gathering input from employees, but in our experience, leveraging this powerful knowledge base sooner rather than later helps identify root challenges and opportunities to improve faster and more effectively.
Also read: Crafting Employee Experiences That Improve Customer Experiences
Now, the how. After both qualitative and quantitative data has been collected, follow these steps:
Map your qualitative data

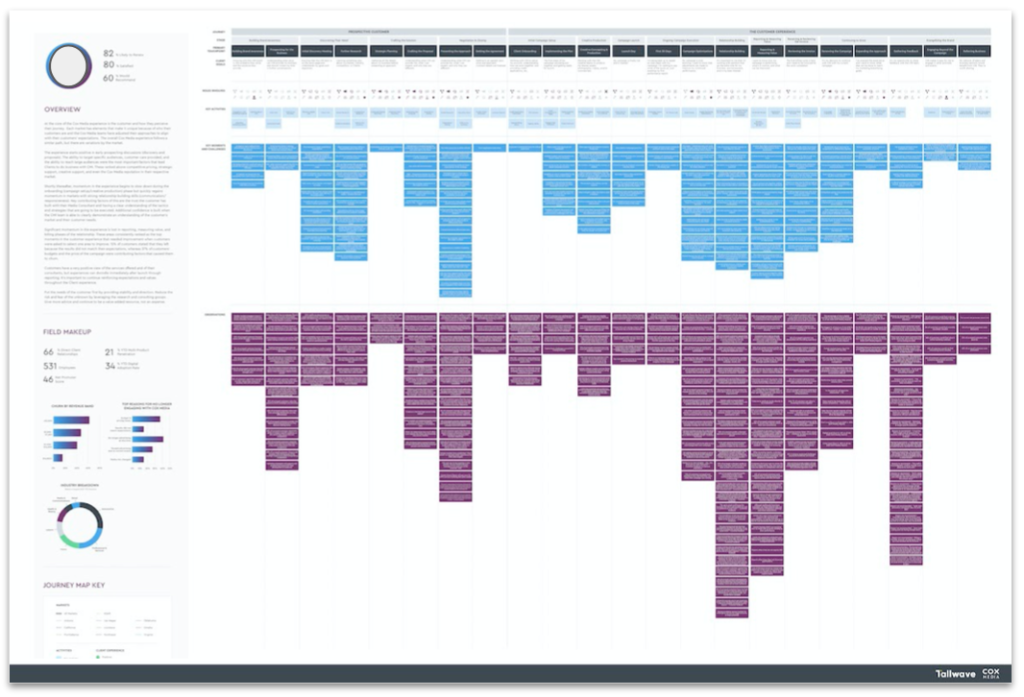
Using the qualitative data gathered, map internal perspectives around critical touch points and test it against customer feedback that was collected. This should reveal discrepancies between what internal teams believe is important, versus what customers assign value to. By taking this qualitative approach, teams can visually display opportunities and challenges within the current experience. Providing a picture that illuminates the differences between internal and external stakeholder perception makes achieving cross-functional alignment on future plans easier. There’s not a whole lot to argue about when the writing’s on the wall.
Pinpoint exact moments of friction and/or leverage in your customer journey
Utilize quantitative methods via surveys and other previously mentioned techniques to analyze customer sentiment – opinions and responses – as well as perspective at every stage of the journey. Keep in mind, each interaction a consumer can have with your brand, both passive and active, is a touchpoint and part of your overall brand journey. Therefore, every interaction must be diligently and continuously monitored, evaluated and iterated because one singular touchpoint can cultivate customer affinity or aversion.
Pair quantitative customer sentiment with a qualitative understanding of the user journey

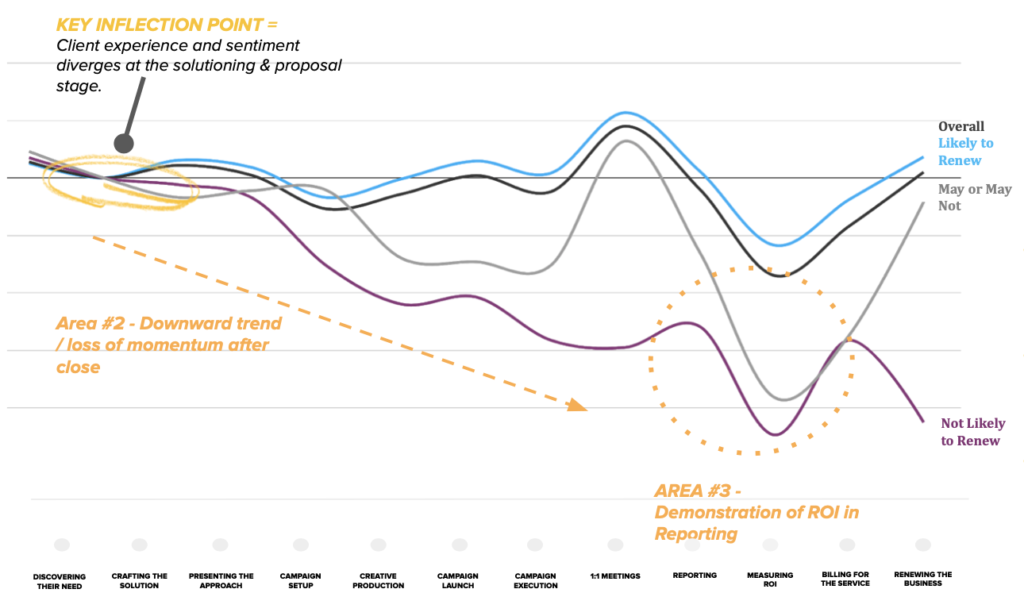
Quantifying the customer journey creates a data-driven understanding of the critical inflection points that drive loyalty and churn. This naturally illuminates root causes of friction (or conversion!) and enable teams to be data-driven in problem solving and planning for future CX initiatives and investments.
How To Use Qualitative & Quantitative Data To Decide on Next Steps
At Tallwave, we create an ‘Impact Matrix’ – this tool highlights opportunities for improvement and compares the impact they’ll each have against the level of effort and investment they’ll require. This helps create alignment and buy-in for low-risk, high impact initiatives that are critical to shaping and improving the customer experience.
Find a similar exercise or tool to visually demonstrate all the opportunities that lie ahead and inform the build of a new strategic roadmap that can take your teams and company into the future.
Perhaps most importantly, don’t let perfection get in the way of progress! Making big system changes to your end-to-end user experience may take time, but avoid trying to solve it all at once. Identifying the biggest opportunities and making incremental improvements over time, while learning along the way, will make a huge difference.
Last but not least, don’t stop. This isn’t a “set it and forget it” game. Customer behavior – be it with an existing website, application or with a brand across numerous touchpoints – must be closely monitored to ensure both user and business goals are consistently met. If they’re not, all teams – Content Strategy, Product Development, People & Culture, Performance Marketing – must align to identify solutions for evolution and continue growth.
Don’t let perfection get in the way of progress! Identifying the biggest opportunities and making incremental improvements over time, while learning along the way, will make a huge difference.
Bottom Line
Let data be your guide. Qualitative input is key, especially early on, but also leverage quantitative data as much as possible to make decisions. The combination of qualitative and quantitative helps you identify where there is friction, but also gives you the context you need to develop solutions that hit the mark. And if you don’t have the right data infrastructure set up today, that’s a good place to start.


