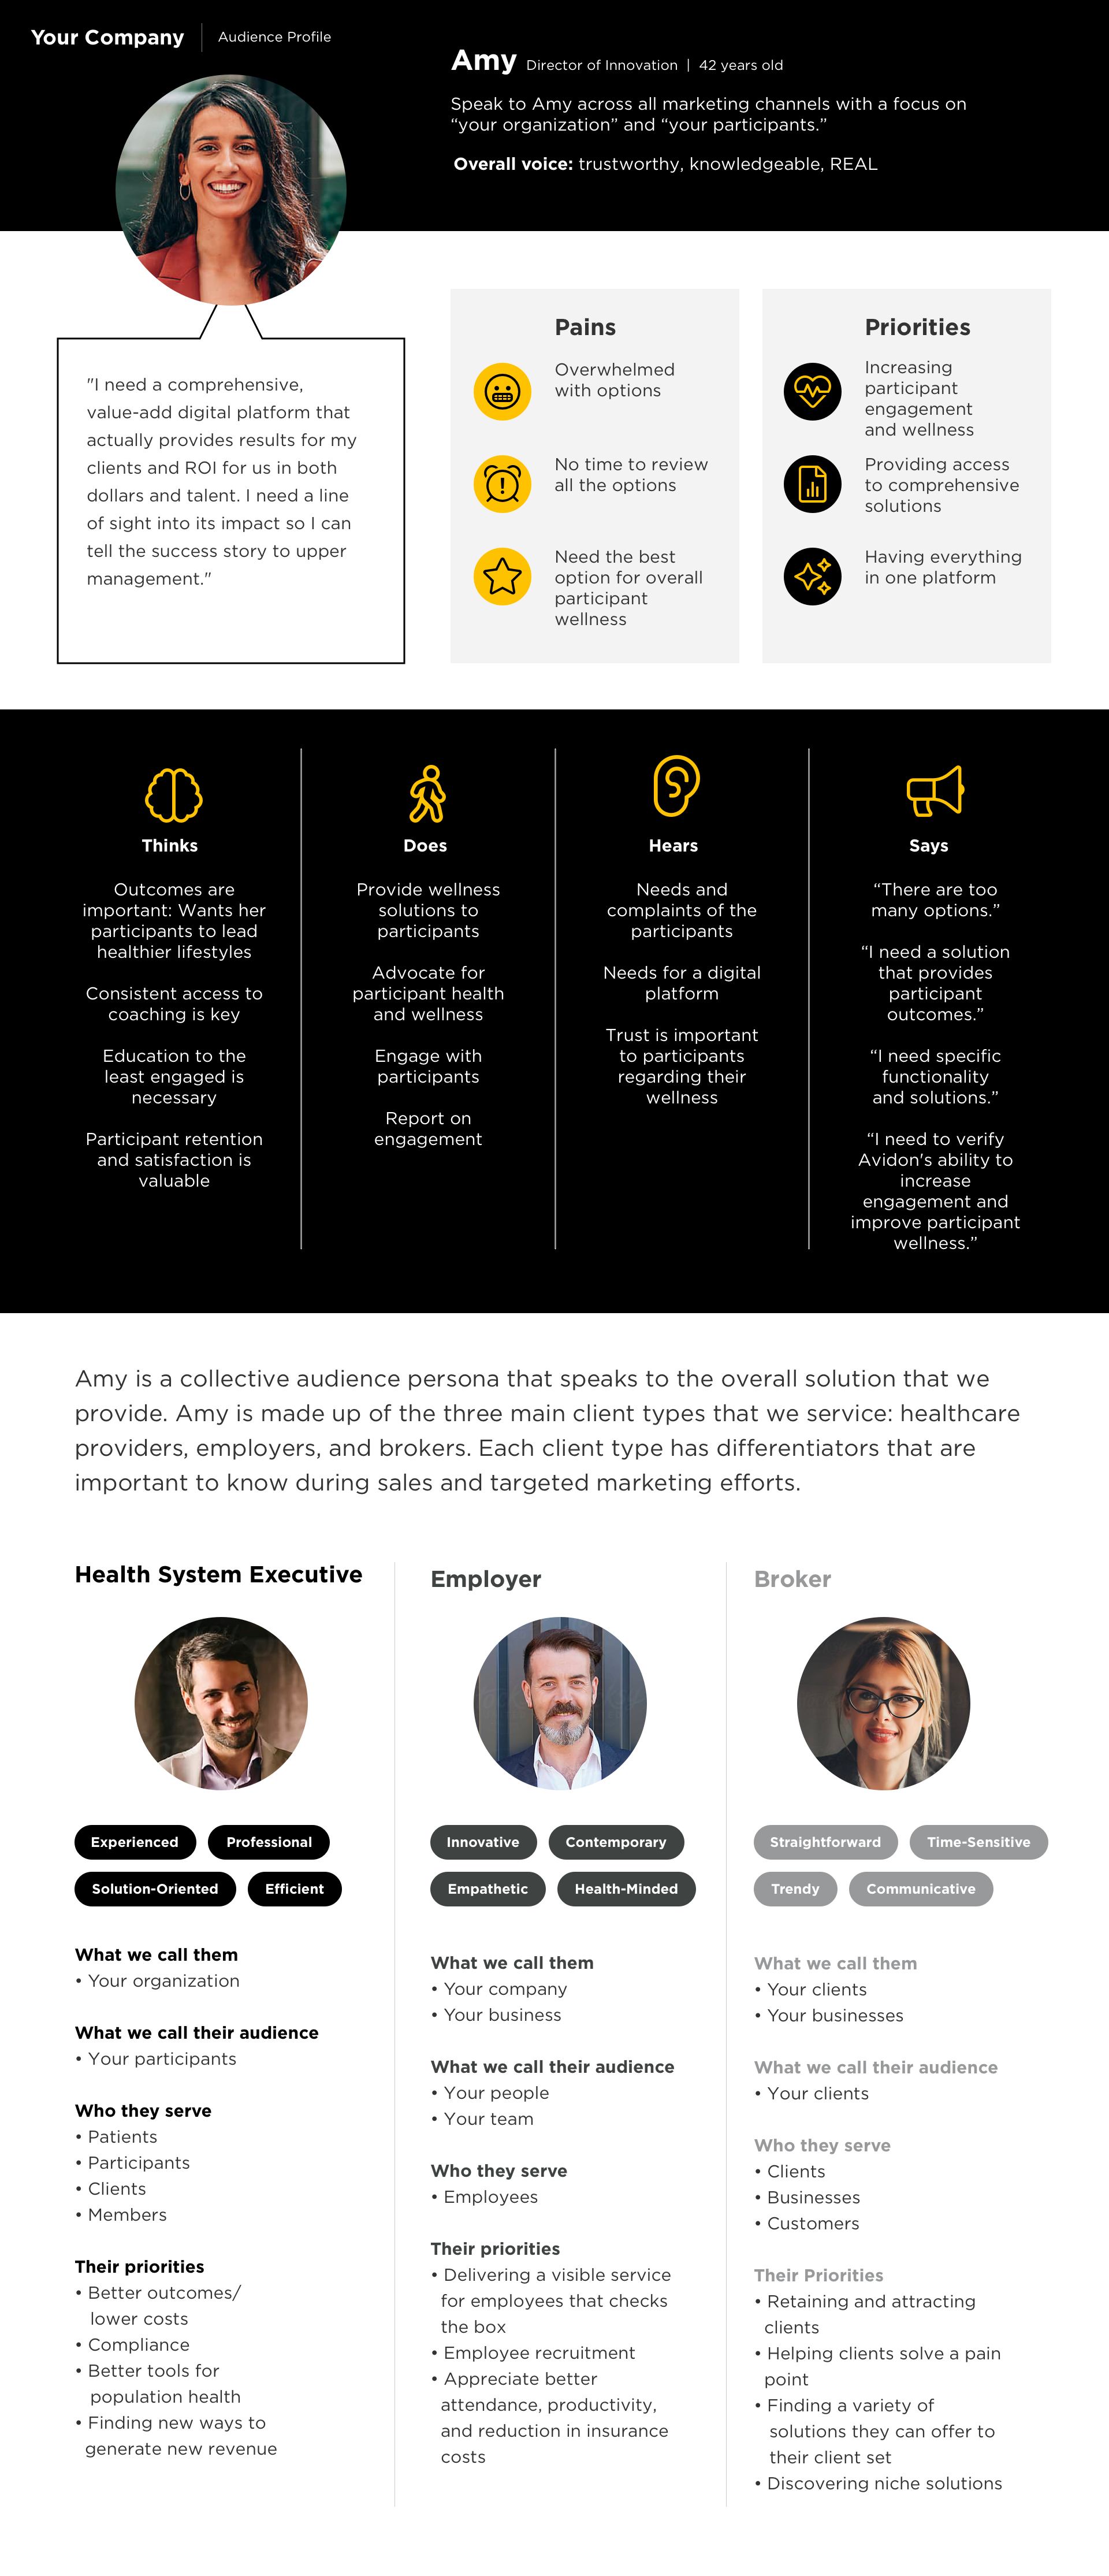
It’s a simple fact: businesses today thrive on data. This means establishing a strong data foundation is more crucial now than ever. Business leaders are increasingly interested in leveraging AI tools, yet the key to unlocking these tools’ full potential lies in the robustness of your data infrastructure.
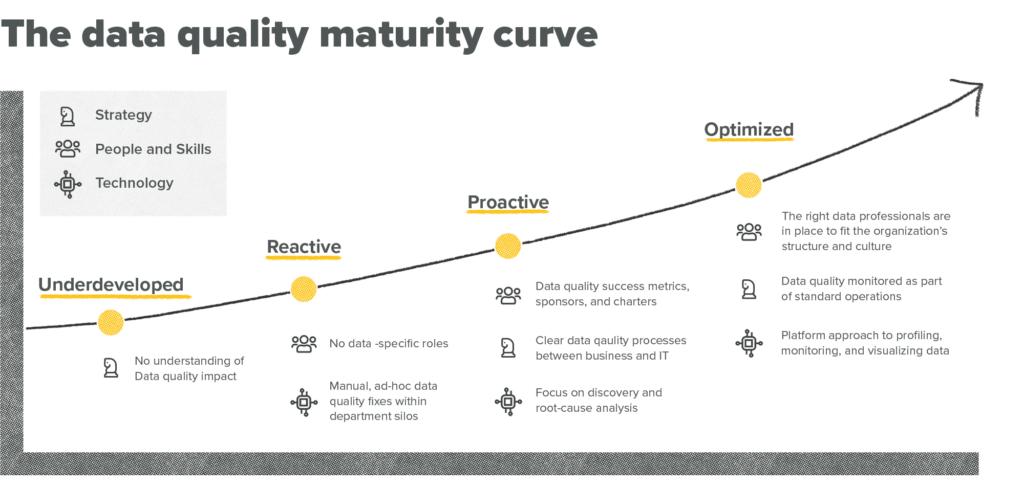
What do you need to build a future-proof data foundation? Thankfully, though your business’s data needs may be complex, advancing toward making more informed decisions and moving your organization further up the data maturity curve doesn’t have to be if you have a solid data foundation in place.
What is a data foundation?
Picture a house built on a shaky foundation. Cracks appear in the walls, doors become misaligned, and the whole structure feels precarious.
A strong data foundation is the cornerstone for any organization that seeks to harness the potential of its data. This behind-the-scenes strategy ensures your data is meticulously organized, takes advantage of automation capabilities, is rock-solid in reliability, and is impenetrable in security. Think of it as the intricate plumbing and electrical wiring of your data house—not flashy, but absolutely essential for everything to run smoothly.
Here’s what a strong data foundation provides:
- Centralized storage: No more data scattered across spreadsheets and disconnected platforms. A strong data foundation stores everything in a single, secure location for easy access and analysis.
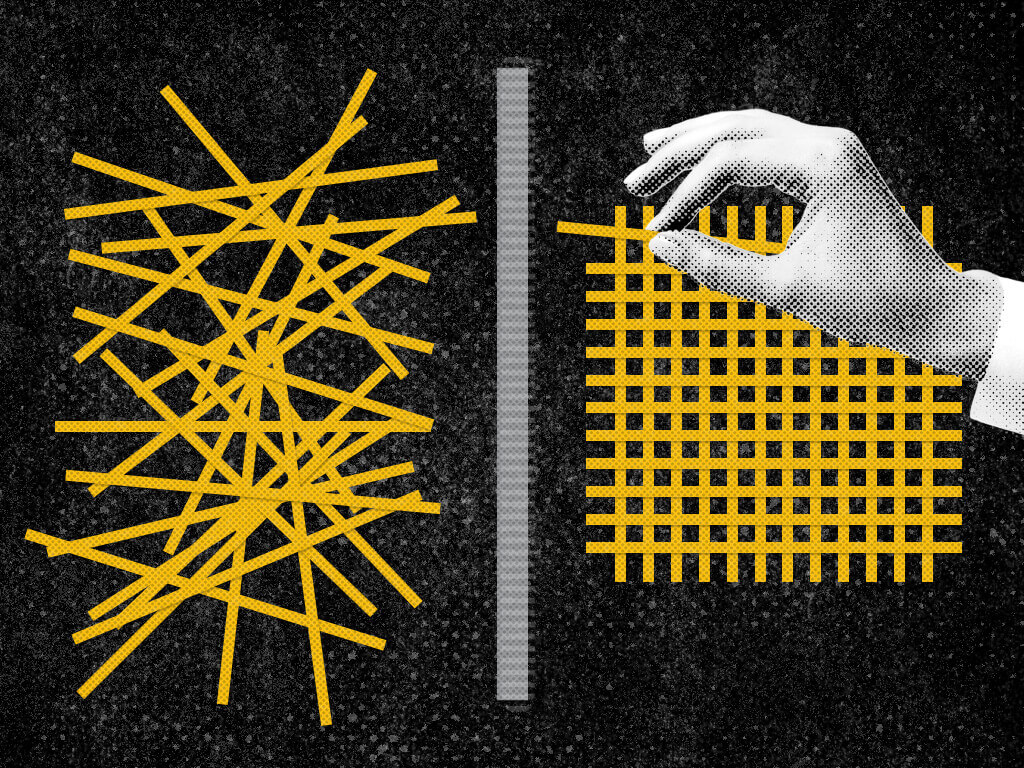
- Seamless integration: Gone are the days of fighting with data from different sources and wasting hours manually aggregating. A strong data foundation uses data integration tools to combine information from various systems, creating a unified view of your data. This eliminates the need for manual data manipulation and ensures consistency across your datasets.
- Reliable processing: Efficient processing tools ensure your data is cleasned, transformed, and analyzed quickly and accurately, ready for analysts and business stakeholders to extract valuable insights they need to make decisions.
- Data governance: Clear policies and procedures keep your data safe and reliable. Data governance establishes guidelines for data ownership, access control, and security protocols. This ensures data integrity, protects sensitive information, and keeps your organization compliant with relevant regulations.
- Solid data architecture: A well-defined data architecture is the backbone of your data foundation. This blueprint defines how your data is structured, stored, and accessed. A strong data architecture ensures your data is organized to optimize storage, simplify analysis, and facilitate future growth.
In short, a robust data foundation is a critical enabler of all data-driven activities within your organization. It empowers you to generate insightful reports, make data-backed decisions, and unlock the true potential of your information assets.
Coming to terms with the true state of your existing data infrastructure
Let’s keep the house analogy going. Say you want a new kitchen. Before you decide between a drop-in sink, undermount sink, or even a farmhouse sink, you need to assess the plumbing to understand what steps need to be taken to install your dream sink.
Similarly, evaluating your current data infrastructure is the first step to establishing a strong foundation for future data success.
This involves a close look at four key areas:
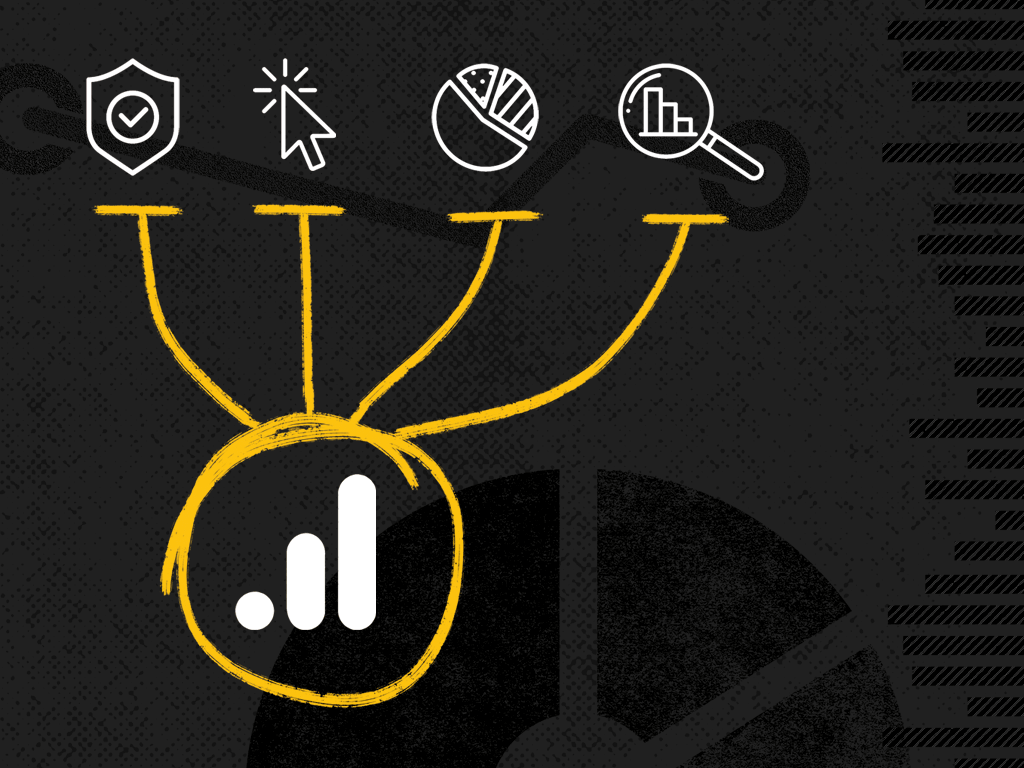
- Data sources: Where does your data come from? Customer relationship management (CRM) systems, customer data platforms (CDPs), website analytics tools like GA4, and ERP systems all contribute to your data ecosystem. Mapping your data sources helps identify potential inconsistencies and opportunities for integration.
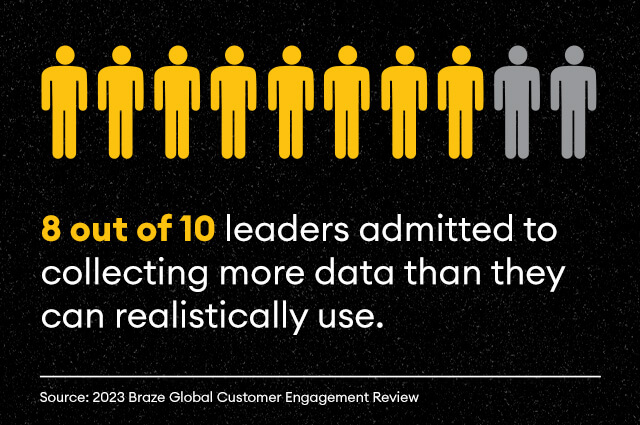
- Data quality: Is your data accurate, complete, and up-to-date? Imagine building reports based on customer addresses with a high percentage of typos. The insights wouldn’t be reliable. Data quality audits can help identify missing information, inconsistencies, and inaccuracies.
- System performance: How quickly can your systems process and analyze data? Slow data processing can bottleneck your entire data pipeline, hindering your ability to generate timely insights. Performance audits can reveal bottlenecks and identify areas for improvement.
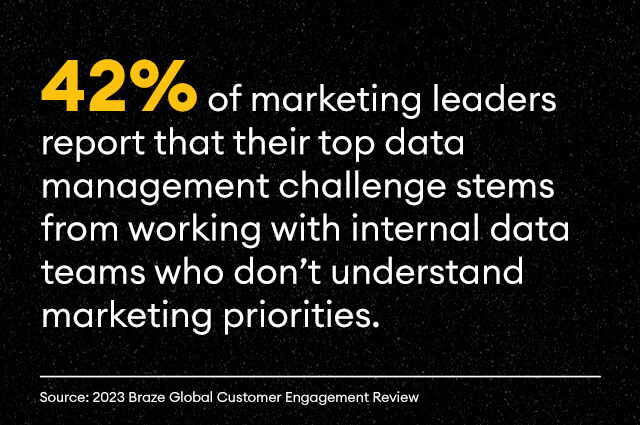
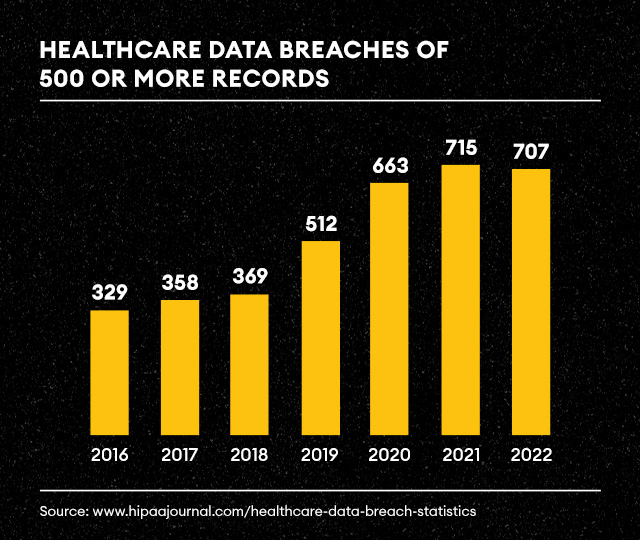
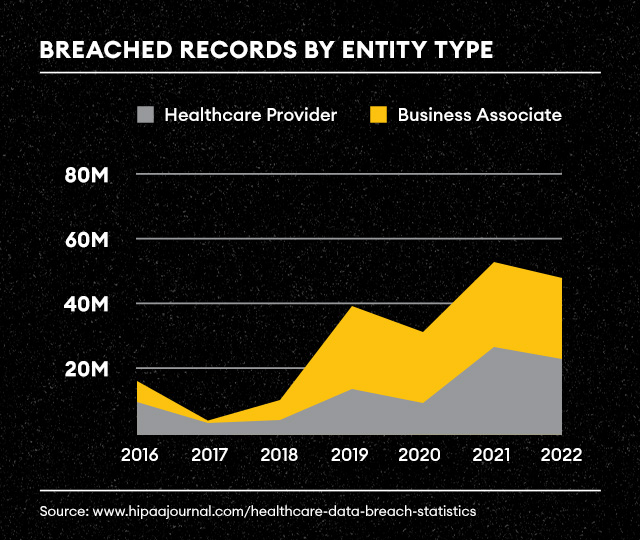
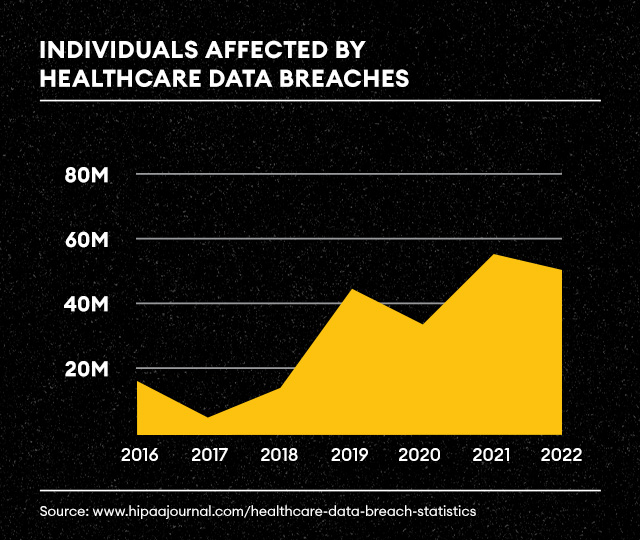
- Governance policies: Do you have clear guidelines for data ownership, access control, and security? Robust data governance policies are essential for protecting sensitive information and ensuring compliance with regulations. A gap in data governance can lead to security breaches and regulatory fines. We’ve seen this unfold with healthcare analytics in real time.
Conducting audits in these areas will help you identify your strengths (e.g., robust security protocols) and weaknesses (e.g., data silos, inconsistent data formats). This forms the roadmap for building a data foundation that truly supports your organization’s goals.
Keeping your data house in order: From blueprint to upkeep
Building a solid data foundation is like constructing a dream home. It doesn’t have to be fancy or complex, but you wouldn’t start laying bricks without a blueprint. And you wouldn’t let the finished house fall into disrepair.
The blueprint: Data lifecycle management
Think of your data lifecycle as the blueprint for your data house. It dictates how each piece of information is handled, from its creation to its eventual disposal, and it involves:
- Data retention policies: Just like building codes define the lifespan of a structure, data retention policies determine how long different types of data need to be kept. Customer purchase records might require a seven-year stay, while website analytics might only require a two-year residency. This ensures you comply with regulations while not cluttering your data house with unnecessary information.
- Archiving strategies: Not everything needs to be readily accessible in your main living space. An archive is like your attic; it stores infrequently accessed data in a cost-effective way. Think of historical sales figures. They’re valuable for long-term trend analysis, but you probably don’t need them readily available for daily tasks. Archiving frees up space in your primary systems while keeping the important information within reach when needed.
- Secure disposal: Demolition requires care. You wouldn’t simply bulldoze a house without proper procedures. Secure data disposal ensures that sensitive information is erased completely before being “demolished.” Think of it like shredding old documents before throwing them away. This prevents unauthorized access to sensitive data even after it’s no longer needed.
Monitoring and maintenance: Data foundation housekeeping
Even the sturdiest house needs regular maintenance. Here’s how to keep your data foundation in tip-top shape:
- Continuous monitoring: Consider a home security system—it constantly monitors for potential problems. Similarly, continuous monitoring tools keep an eye on your data. They detect anomalies in data quality or system performance, acting like smoke detectors that alert you to potential issues before they cause major damage.
- Proactive maintenance: Regular maintenance is key to preventing problems in your house. The same goes for your data foundation. This involves updating software (like patching leaky pipes), optimizing databases (like cleaning out the gutters), and reviewing security protocols (like checking the locks on the windows). These tasks ensure your data house remains secure, efficient, and ready to serve your organization’s needs.
With these measures, you can ensure your data foundation is well-built and well-maintained. This keeps your data house in order, allowing you to unlock its true potential and confidently make data-driven decisions.
The importance of a strong data foundation
The digital age has ushered in an era where accurate, reliable data is a fundamental asset. For businesses aiming to utilize AI and machine learning at an enterprise level, a solid data foundation is paramount. Without it, efforts to implement advanced technologies just won’t work. A robust data infrastructure enables efficient data management, ensuring information is accurate, accessible, and secure.
By prioritizing a well-maintained data foundation, you’re laying the groundwork for a successful and adaptable business. It’s what keeps your data house in working order, allowing you to make informed decisions, unlock the power of AI, and keep your competitive edge.
Building a strong data foundation is an ongoing process that requires commitment and strategic planning. Start by evaluating your current infrastructure, address identified weaknesses, and invest in technologies and processes that support your long-term data goals.
Ready to get your data foundation in order?
A strong data foundation is more than just a string of buzzwords; it’s a fundamental requirement for any business looking to thrive in the digital age. By understanding the importance of a solid data infrastructure and taking proactive steps to build and maintain it, businesses can unlock the full potential of their data, paving the way for advanced AI capabilities, and sustained growth.
And just as you would hire a contractor to help you build your dream home, Tallwave is here to support you in setting up a strong data foundation. Our data strategy and analytics team can help you unlock opportunities and empower informed decisions, all coming together to drive innovation. Let’s talk.