Categories
Customer Engagement Uncategorized

Unlocking the power of data storytelling

Once upon a time, interpreting data was as simple as processing numbers. But with the volume of data collected multiplying exponentially every day, simply being able to analyze and interpret that data is no longer sufficient. Quickly providing data points and metrics without additional context and a story around what happened to produce the numbers and what to do about it is meaningless to business users who need to make decisions for their organization. 

Enter the world of data storytelling, the art of communicating data-driven insights effectively. This approach embraces narrative analytics and weaves facts and numbers into actionable insights.

The prologue: Why data storytelling matters

Data-driven storytelling is the art of transforming complex data sets into a compelling narrative. This narrative uses context, visuals, and insights to engage a specific audience and ultimately influence their decisions or understanding. It should be an essential part of any organization’s data strategy for two main reasons:

1. Data storytelling fosters engagement

In business, engagement is not just a buzzword; it’s a strategic imperative. While raw or straightforward data might be the backbone of decision-making, it’s the narrative around that data that provides qualitative context for quantitative information and mobilizes teams to action. Combining both straightforward data with an illustrative narrative via data storytelling transforms abstract figures into a compelling story, fostering engagement and understanding at every level of your organization.

2. Data storytelling enables understanding across teams

Bridging the gap between technical experts and non-technical stakeholders is a challenge that data storytelling helps to address. It presents the data in a way that is accessible to business users regardless of their technical or analytical expertise. There is an increasing need across numerous industries to bring these two groups together via data storytelling. Read our blog about bridging that gap here and how we have been successful at bringing teams together for the benefit of the overall organization. 

The plot: Elements of compelling data stories

The elements of compelling storytelling with data are like characters coming together to set the scene in your favorite novel. Consider your approach to the data story, how you’ll illustrate the story, and the potential impacts of your story with the following elements:

Audience-centric approach

In order to be effective, a data story must be crafted for the audience at hand. The storyteller must ensure they understand the motivating factors and perspectives of the intended audience. This oftentimes requires stakeholder discussions to build a clear understanding of metrics and KPIs that are relevant to respective audiences and/or persona groups. It also requires a solid partnership and mutual understanding of how stakeholders are using their data to make informed decisions. Without this context, storytelling around the data is much less effective.

Visualizing data for clarity

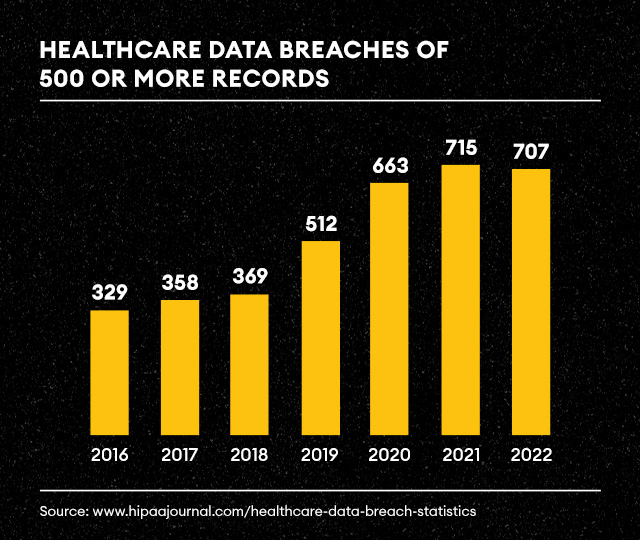
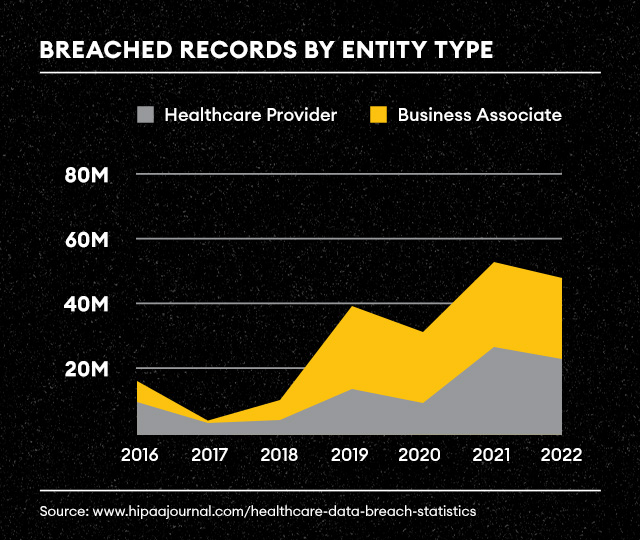
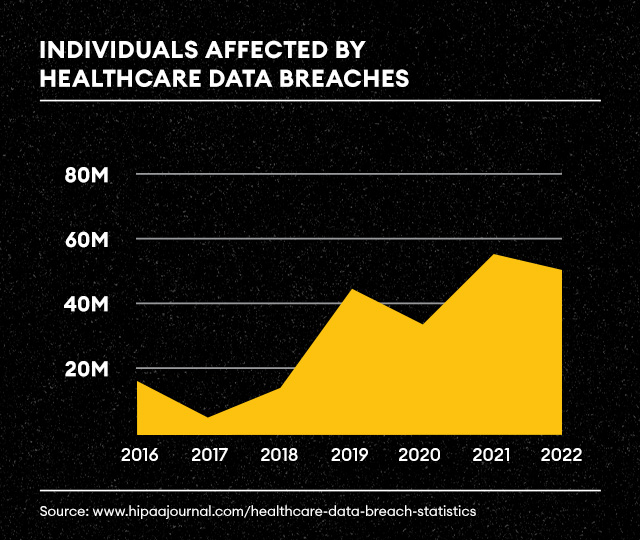
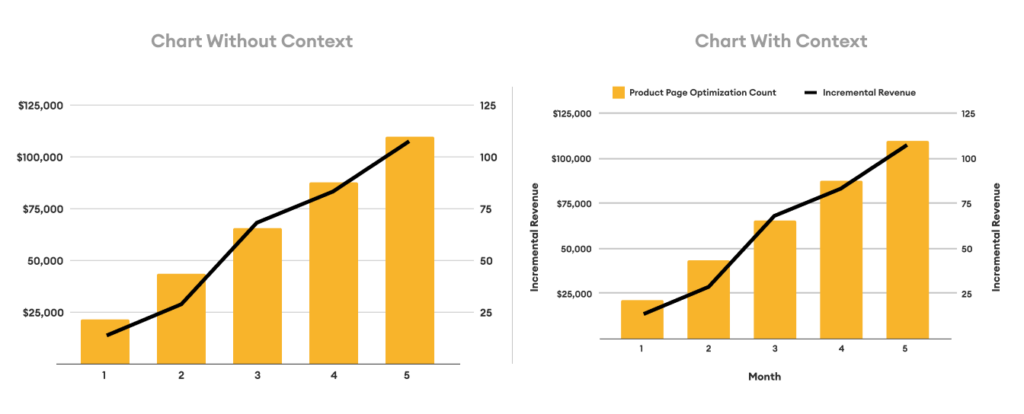
Data visualization is the brushstroke that brings your data story to life. Data without visuals is like a story without illustrations—less engaging and prone to misinterpretation. However, it is important to explore the art and science of visualizing data for clarity. Certain data points might be best visualized in a scatter plot versus a bar chart and it is important to think through the best and most straightforward visualization for stakeholders. Visual literacy is a superpower. It is also critical that data visualizations do not leave anything to be misinterpreted. While it is important not to clutter and overly complicate visualizations, clear and succinct titles and labels can make or break a visualization. Take a look at our example below.

Psychological power of storytelling

The human brain craves stories. There is neuroscience behind storytelling and why stories stick. Engaging multiple parts of the brain enhances the memorability of your data narrative, creating lasting impressions that transcend the numbers. Doing so is akin to creating a symphony of cognitive responses. By triggering various brain regions simultaneously, a well-crafted narrative becomes an immersive experience, leaving a lasting imprint on the audience’s memory.

Giving data a narrative engages multiple parts of the brain for emotional and empathetic processing. This is where it becomes more about the story than the raw numbers. The story becomes an experience, a journey that the audience embarks upon, making the data more than just information—it becomes a memorable and impactful narrative. The data narrative becomes a part of the audience’s cognitive landscape, ready to be recalled and reflected upon.

Learn more about Data Strategy & Analytics Services at Tallwave.

Intermission: Tallwave’s data storytelling in action

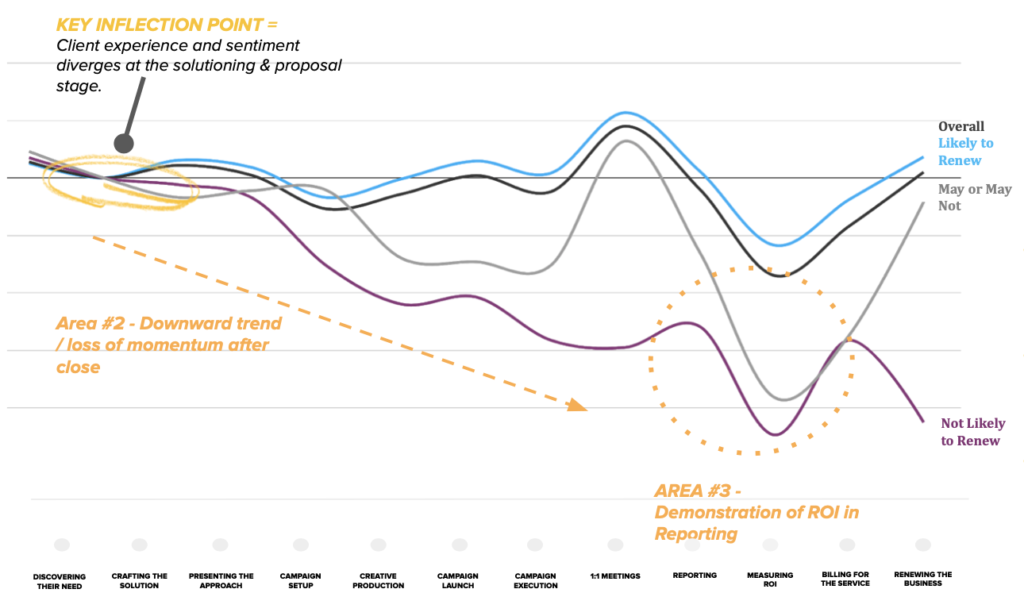
Narrating the full sales picture: A real example

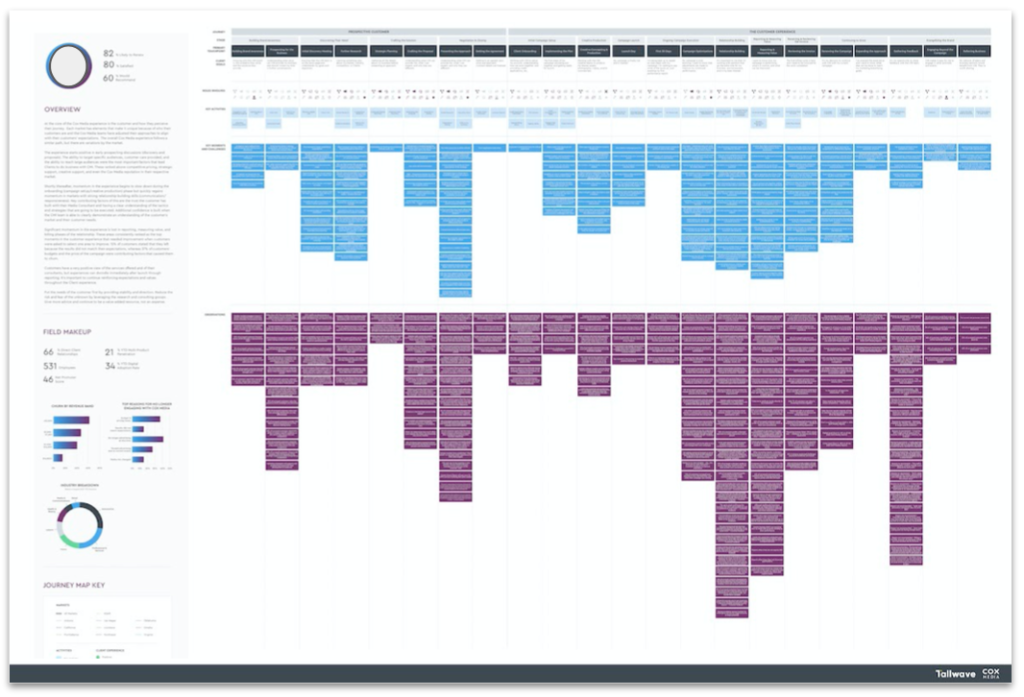
Let’s dive into a real-world application of data storytelling. During a typical monthly reporting cycle, one of our clients, an e-commerce company, identified declines in sales and revenue across multiple digital channels on their owned website. Initially focused solely on e-commerce sales, the team was alarmed by the decline in organic and paid search sales. However, a more comprehensive understanding of the full story, including sales through brick-and-mortar partners, 3rd party marketplaces, in-store, and phone orders revealed a different story—increases in sales with partners resulted in greater TOTAL sales, and naturally cannibalized some of the sales from other sources.

In order to better tell this story, Tallwave created customized, purpose-built, actionable dashboards in Google Looker Studio. These dashboards helped to mitigate risk of misinterpretation, presenting a clear and concise representation of the sales landscape. It is not uncommon for individual stakeholders to misinterpret data that they might have a personal or departmental bias toward and inadvertently lead other stakeholders astray. Nor is it uncommon for individual stakeholders to exert their own bias in a way that tells the story they believe to be true. This is why it is important to include cross-functional stakeholders involved in rounding out the data story or dashboard visuals to ensure consistent KPI understanding and consensus.

A purpose built dashboard identifying products with a low add to cart to view ratio that the organization should focus on improving this ratio by comparing competitor price points, inventory availability, lack of useful information listed on the product page, etc..

The resolution: Practical tips for effective data storytelling

Reducing complexity

In an era where information inundates every corner of our professional landscape, simplicity emerges as a guiding principle in effective data storytelling. The call is clear: advocate for simplicity in both language and visuals, ensuring your data story is accessible to all members of your audience.

Language Simplicity: Complex jargon and convoluted terminology can act as barriers to understanding. Embrace clear and concise language, choosing words that resonate with a broad audience. Your goal is not to showcase your vocabulary but to convey the essence of your data story in a way that everyone can grasp.

Visual Simplicity: Complexity in data visualizations often leads to confusion. You do not gain style points for making data visualizations complex and difficult to interpret. Instead, opt for visual simplicity. Choose charts and graphs that convey the message without overwhelming the viewer. Consider the power of minimalist design, where each visual element serves a clear purpose.

The art of simplicity in data storytelling lies in finding the delicate balance between conveying intricate insights and ensuring comprehensibility. Simplicity does not mean sacrificing depth; rather, it involves distilling complexity into a form that enlightens rather than perplexes.

The theme: Emotion and impact

In the realm of data, numbers tell a story, but it’s the human connection that makes it memorable. Data storytelling is not just about numbers; it’s about people.

Humanizing Data: Every data point represents a real-world scenario, a decision, or an outcome that impacts individuals. Infuse life into your data by humanizing it. Share anecdotes, testimonials, or real-life examples that resonate with your audience. By connecting data to real people, you create a narrative that goes beyond statistical significance.

The true power of emotion in data storytelling lies in its ability to inspire action. An emotionally resonant story is more than a set of charts; it’s a call to action. 

Within a compelling data story each element contributes to the overall harmony. It is also important to maintain consistency in your data narrative.

The twist: Can AI effectively assist in data storytelling?

AI in data storytelling: A double-edged sword

Data and analytics are always evolving and changing. Along with many other use cases, Artificial Intelligence (AI) emerges as a powerful tool to aid in crafting compelling narratives. However, this opportunity also comes with its complexities and challenges. Let’s explore how AI can effectively assist in data storytelling, its responsible usage, and the potential pitfalls that counteract efforts to tell a story with data.

AI’s role in enhancing data storytelling

AI offers the ability to sift through vast datasets, identifying patterns and trends that a human might overlook. Automation from AI can also assist in uncovering key narratives without as much of an exhaustive manual effort. With the help of AI, data stories can be tailored for specific audience segments, considering individual preferences and comprehension levels. This personalization ensures that the narrative resonates with diverse stakeholders, enhancing engagement and understanding.

Using predictive analytics can also be a big factor in forecasting future trends based on historical data. Integrating these predictions into data stories provides a forward-looking dimension, empowering decision-makers with strategic insights.

Responsible use of AI in data storytelling

It is important to be transparent about how you use AI algorithms to contribute to data storytelling. Specifically, outlining how AI is being used to process data ensures that stakeholders understand the methodology behind automated insights. This is critical for building trust with your audience.

While AI assists in streamlining the data analysis process, human oversight is absolutely imperative and neglecting the need for human oversight when building a data story could result in a less effective narrative. Human intuition and contextual understanding add a nuanced layer to storytelling that AI may lack. Striking a balance between AI assistance and human interpretation is key to responsible usage.

There is also a risk of AI identifying correlations without establishing causation. This can lead to misinterpretation of data relationships, potentially distorting the narrative and steering decision-makers in the wrong direction.

If you endeavor to use AI as a tool in your toolkit, to enhance your story, rather than using it as a crutch to tell your story, you will be exponentially more effective. 

The resolution: Navigating success in data storytelling

By acknowledging and addressing complex datasets, avoiding unnecessary complexity to prevent misinterpretation, and encouraging data literacy across various teams, organizations can transform the potential impediments into catalysts for success in data storytelling. At Tallwave, our data experts are equipped to support your data storytelling needs. We can help you embrace technical advancements, foster a culture of collaboration, and prioritize education to bridge the knowledge gap. Let us help you tell a comprehensive data story today!

Categories
Customer Engagement Uncategorized

Cloud security management: Safeguarding your data

Over the past few years marketing and IT teams have been flying high with cloud-based innovations. These servers and software “in the sky” are aimed at improving flexibility, scalability, and efficiency of handling and accessing the data that empowers marketers to make the informed decisions they need to reach their target audiences and provide great consumer experiences. From collecting and storing paid media analytics to scheduling automated campaigns, the cloud seems to be the key fueling your brand’s digital ascent. 

But as you soar amidst the data-driven clouds, a question whispers in the wind: is your data safe?

Enter cloud security management, the vigilant guardian in this digital sky. It’s the framework, the set of tools, the sleepless protector ensuring your prized marketing data navigates the cloud with confidence and integrity.

The cloud security landscape: From seedling to towering tree

Cloud security’s journey began decades ago, as a tiny sapling sprouting from concerns about online data vulnerability. Today, it stands tall as a mighty oak, offering robust solutions across industries. But for marketers and IT teams who rely on high-quality data to drive actionable insight, understanding where you are in this forest is crucial. Are you just planting the seeds of cloud adoption, or do you have sprawling data ecosystems nestled within its branches? Identifying your stage sets the foundation for your cloud security management journey.

Learn more about Data Strategy and Analytics Services at Tallwave.

Understanding data protection: The roots of secure marketing

The heart of cloud security management is data protection. For many marketing teams, this translates to safeguarding customer information, campaign creatives, and brand-sensitive data. For others, like those who rely on healthcare web analytics data, the roots are even deeper. 

However, cloud security management isn’t without a few thorns. Today’s marketing landscape throws myriad security challenges our way:

  • Evolving threats: Hackers, malware, and data breaches constantly evolve, demanding dynamic, adaptable security measures.
  • Fragmented ecosystems: Multi-cloud environments and third-party integrations multiply data touchpoints, creating a complex security puzzle.
  • Human error: Accidental data leaks or inadequate employee training can unintentionally expose vulnerabilities.

To combat these growing threats, marketing and IT teams might consider an approach with two branches:

1. Data classification and encryption

Prioritize your data, classifying it based on sensitivity and implementing robust encryption measures for high-value information. Secure cloud storage solutions further solidify your digital fortress.

2. Cloud security standards

Adopt industry-standard practices like strong password policies, access controls, and regular security audits. Remember, prevention now is always better than breakfixes later.

So, having acknowledged the critical role of data protection, the question that begs to be asked is: how can we actively implement best practices and tools to build a data sanctuary within the cloud that protects and enables our marketing initiatives?

Best practices for cloud security management: Building your data a secure shelter

Let’s delve deeper and explore the practical tools and best practices marketers and IT teams can leverage to ensure data stays safe in the cloud.

Cloud security monitoring and threat detection

Invest in tools that continuously monitor your cloud environment for suspicious activity and potential threats. Early detection is key to swift and effective containment. Tools can vary by cloud provider. Those using AWS might look to GuardDuty or Amazon Inspector, while those on Azure might consider Microsoft Defender for Cloud or Log Analytics.

Future-proof your environment

Stay ahead of the curve by constantly evaluating and updating your cloud security measures. Remember, the digital landscape is ever-shifting, and so must your defense mechanisms.

Secure cloud storage

Choose reliable cloud storage solutions that offer robust security features, data redundancy, and disaster recovery options. Your marketing data deserves a digital vault, not a cardboard box.

Cloud security policy

Craft a comprehensive cloud security policy that outlines data handling procedures, employee training protocols, and incident response plans. Clear guidelines are your best friend in crisis mode.

Regulations like GDPR and HIPAA add another layer of complexity to the cloud security puzzle. Risk management in cloud security is key, by regularly assessing compliance and actively managing potential risks, you can chart a secure course through the regulatory waters. Other guidelines, like SOC 2 and ISO 27001, provide a roadmap for achieving and maintaining compliance, earning you precious trust and peace of mind.

Embarking on your secure cloud journey

Cloud security management may seem daunting and like a maze of risks and regulations. But remember, you don’t have to navigate it alone. Cloud security solutions abound, offering tools, expertise, and managed services to guide you every step of the way.


At Tallwave, we understand the intricacies of cloud security, especially in the dynamic world of digital marketing. Our team of marketing data strategy experts is ready to equip you with the knowledge, tools, and confidence to conquer the cloud’s highest peaks. Tallwave is just a cloud hop away; we’re here to help when you need us.

Categories
Strategy

Healthcare Web Analytics in 2023: Get Your Data In Order

On December 1, 2022, the U.S. Department of Health and Human Services’ (HHS) Office of Civil Rights (OCR) issued a bulletin stating that the use of third-party cookies, pixels, and other tracking technology by healthcare companies may be violating the Health Insurance Portability and Accountability Act (HIPAA). This is in the wake of a year of unprecedented data breaches involving business associates, or third-party vendors, throughout the healthcare industry. 

Bar chart showing a steep increase in healthcare data breaches since 2016
Source: www.hipaajournal.com/healthcare-data-breach-statistics

2022 saw over 700 healthcare data breaches impacting more than 50 million individuals. And nearly a third of the ten most significant breaches were due to third-party tracking pixels from companies like Google and Meta (Facebook). While Google and Meta help companies understand their website and other owned properties’ usage, users of the platform have inadvertently also exposed data ranging from personally identifiable information such as Social Security numbers, driver’s license numbers, and financial account information to medical record numbers, insurance account numbers, and more.

Chart showing healthcare analytics data breaches by entity
Source: www.hipaajournal.com/healthcare-data-breach-statistics

Such breaches come with hefty financial penalties, including fines, settlements, and other repercussions for the entities involved. But a more significant impact is felt by the consumer whose data has been compromised, as stolen personal information can result in identity theft. And recovery from identity theft is often a long and burdensome process.  

Graph showing a steep increase in the number of individuals impacted by healthcare analytics breaches since 2016
Source: www.hipaajournal.com/healthcare-data-breach-statistics

Up until last December when HHS issued its bulletin, it had not provided formal guidelines regarding sensitive healthcare data and HIPAA relative to online tracking technologies. So what does this announcement mean and how can healthcare organizations stay HIPAA compliant?

What do the HHS changes mean for healthcare organizations?

A good starting point is an understanding of the technologies involved and the risks they pose. The HHS announcement specifically speaks to tracking technologies, often third-party, which are generally anonymized. Tracking cookies, specifically pixels, are tiny bits of embedded code used to track a site visitor’s online activity. The data collected from the pixels provides insights that allow the site owner to develop marketing strategies, such as on-site personalized experiences and off-site retargeting campaigns, specific to each site visitor’s behaviors and interactions.

The problem? Many healthcare organizations are using third-party pixels to gain a better understanding of how they can optimize the digital experiences within their public-facing websites and patient portals. And these pixels may be sharing protected health information (PHI) inadvertently with third parties. Most often, the concern lies with pixels on the patient portal, a secure website or application where patients can access and interact with their health data. But PHI can also be collected from the public website and mobile apps in the form of cookies, web beacons, fingerprinting scripts, and other scripts. 

So what constitutes PHI? 

Protected health information is any information related to an individual’s past, present, or future health, healthcare, or payment for healthcare. This includes, but is not limited to:

  • Medical records, be they physical, electronic, or spoken
  • Information pertaining to billing, insurance, or of any financial aspect of an individual’s health or healthcare
  • Demographic information
  • Mental health conditions
  • Tests and laboratory results 
  • All information related to an individual’s diagnosis, treatment, or prognosis
  • Anonymous session user ID

As of December 1, 2022, anonymous session user ID is considered PHI.

Anonymous user identification allows the website to anonymously identify unique site visitors without the user having to log in or consent to a tracking cookie. Anonymous sessions are captured and aggregated and can include data such as (but not limited to) the user’s IP address, geographic location, language, device, and mobile carrier, but is generally, as the name suggests, anonymous. However, HHS has deemed that these data points connect the individual to the entity and therefore can be related to the individual’s past, present, or future health, healthcare, or payment for healthcare.

The addition of anonymous session user ID considered as PHI now adds additional complexity to an already confusing data security landscape. Furthermore, in order to protect themselves and their patients, the onus is on healthcare providers to ensure they and their partners are not improperly using tracking technology on the healthcare provider’s digital properties, mobile apps, etc.

How can healthcare organizations keep web analytics HIPAA compliant?

As there is no easy website or mobile app consent solution, it is best to develop a compliant strategy that will protect both the healthcare organization and its consumers. Developing a compliant strategy requires engaging all departments (marketing, marketing analytics, legal, IT, etc.) and ensuring organizational alignment around it. This starts with examining your current analytics tech stack to determine if it meets both the organization’s needs and HHS requirements.

Is Google Analytics HIPAA compliant?

Over 28 million websites worldwide currently use Google Analytics, over four million of which are in the United States. Of all U.S. industries that use Google Analytics, hospital and healthcare companies are the third most prevalent. Google Analytics isn’t the only option for tracking website data, but it has the largest market share, and for good reason. It is robust and intuitive. But Google Analytics has also faced challenges, having been banned in a few European countries due to General Data Protection Regulations (GDPR) violations. Google did take steps toward addressing the European Union’s GDPR requirements with its recent release of GA4.

So, does Google Analytics meet the new requirements outlined in the HHS bulletin? The simple answer is no. In basic and 360 configurations, GA3 and GA4 no longer meet the HHS compliance requirements. This is primarily due to specific attributes of the data sets, specifically the session and user ID dimensions. 

As a result, healthcare companies are expediting their searches for alternative platforms that will provide organizations with the information they need to measure their digital customer experiences and — more importantly — store that data securely.

After the Universal Analytics sunset on July 1, 2023, you will have a minimum of six months to access your previously processed data. Are you ready to transition to GA4?

What are the best next steps toward achieving compliance?

The first step is to identify and outline requirements for a cohesive transition to a new, compliant platform. The most important of these requirements is a HIPAA-compliant analytics platform provider, one that will be covered under a Business Associates Agreement (BAA). The good news is there are a handful of platforms available that fit this important need. 

Additionally, all businesses are unique and have priorities that must be considered when planning a transition to a new analytics platform. Some examples of priorities might include ease of implementation, tag management capabilities, user limits, integrations with other Google products, and interface complexity, among other things. 

Once requirements have been prioritized across internal teams, analytics owners will be able to guide a best-fit decision.

Whether your organization has been using Universal Analytics for years or you have recently migrated to GA4, Tallwave can help you organize around your requirements, gain internal alignment, and provide expertise on next best options all the way through the implementation and reporting transition. Reach out when you’re ready to learn more.

Categories
News This Week in CX

This Week in CX: 3 Big Healthcare Tech Companies & Providers Announce Future CX Plans

The healthcare industry was always going to need to integrate and provide more personalized digital-first experiences for patients. The 2020 pandemic just sped up that demand.


Patient experiences in healthcare – and how to improve them – is something we talk about a lot. Whether with prospects, our current healthcare clients or internal teammates, we’re always hypothesizing, testing, and implementing new data-driven strategies designed to solve the acquisition, engagement, and retention challenges that many organizations are facing. These solutions always have one theme in common: They’re developed with humans at the core and with heart.


This week, a number of companies dedicated to developing technologies and holistic strategies that streamline healthcare experiences and improve patient engagement made announcements that will help organizations get one step closer to delivering truly personalized CX. No matter your CX speciality, these stories serve to showcase the ways in which companies are getting creative with innovative technologies and may provide some much-needed inspiration into CX takeaways for businesses small and large.


Here are the biggest business, tech and data developments that occurred this past week and will most certainly impact how we design and deliver the customer experiences of tomorrow.


HIPPA Just Gave a New Telehealth Video Feedback & Engagement Platform the Green Light


Twenty-first century technology is so cool. A new “video feedback and engagement platform” designed for healthcare providers and pharmaceutical companies fits that bill. Medallia, Inc., a SaaS company that develops technologies for customer experience management, is getting ready to change how healthcare needs are heard and understood with their newest product, Medallia LivingLens.

It all comes down to making patients feel seen, heard, understood, and authentically cared for.

The video solution – which achieved HIPPA compliance this past week – gathers real-time customer and employee sentiment (feelings, perceptions or attitudes that arise during experiences) during telehealth sessions. Using proprietary AI technology, the solution “captures six times more information with video feedback than tradition, open-ended text based solutions, including nonverbal communication, such as body language.” This results in action-based insights that enable practitioners to predict and overcome barriers associated with providing optimal care and exceptional telehealth experiences.


One company currently using the solution, Just Worldwide, says the Medallia LivingLens allows them to analyze patient “video diaries,” understand how patients feel, and uncover what they wish their caregivers knew. “We use it to get the emotional impact of a patient,” explained Sally Udayakumar, Research Manager at Just Worldwide.


This is going to open up a whole new world of care that practitioners are able to provide to patients – including preventative care.


“Organizations and practitioners can only truly be lifelong partners if they are emphasizing and providing preventive care to patients,” says Tallwave Product Designer Chelsey Gloetzner. “Those who are proactively providing preventative and whole-person care will naturally improve patient engagement in-between sick visits.”


Also read: Innovators Q&A: How Avidon Is Solving the Patient Engagement Problem In Healthcare

It all comes down to making patients feel seen, heard, understood, and authentically cared for. Previously, practitioners could only know what patients verbally told them or they could physically observe. Now, Medallia LivingLens allows them to dig so much deeper, and provide a level of care that they’ve never been able to before. And it will only contribute to increased satisfaction and loyalty.


“Patients that know and believe you have their best interest in mind will more willingly partner and trust healthcare providers long term,” says Chelsey.


But will this technology – and telehealth appointments – still persist as the pandemic chapter comes to a close? You can count on it.


“Many patients who have become comfortable with telehealth will still prefer this type of appointment in a post-COVID world,” predicts Chelsey. “More doctors are experiencing the benefits of taking these types of appointments as well. In the future, it is feasible that telehealth will not lose its demand.”


That doesn’t mean all telehealth challenges are resolved. In fact, there’s one outstanding problem that we’re currently helping clients solve for: The need for increased education to help onboard older generations.


“It is a unique challenge because those who would greatly benefit from telehealth appointments due to age, physical limitation or challenges finding transportation to appointments, tend to have the most difficult time utilizing the technology,” Chelsey says. “Without the proper introduction and training for this technology, a large demographic of potential users will not be able to benefit from telehealth appointments. Putting walkthroughs or training within the technology itself will not meet the needs of those who must learn how to utilize this type of technology and the devices they would use it on.”


So, once you know how to connect with your practitioners via the internet, you can bet that computer or mobile phone lens is allowing them to peer right into your soul.

Microsoft’s Healthcare Bot Migrates to the Azure Platform


If you haven’t noticed, you’re surrounded by robots.


Internet bots, that is (think chatbots, Alex, Siri – you get it). And if healthcare organizations weren’t using them before, you can bet they’ll be embedding them into their customer experiences soon.


Microsoft announced their plans to migrate their Healthcare Bot to the Azure platform, enabling healthcare developers to customize bots for both clinical and/or operational uses and build new conversational tools. Additionally, organizations will be able to use the new Azure Health Bot as virtual health assistants, ensure compliance requirements related to privacy and security mechanisms, and merge electronic medical records into touchpoints to drive more personalized, holistic experiences.


“It’s really great to see healthcare companies leveraging and investing in technology to remove barriers and friction from the customer experience,” says our Senior Product Designer Alyssa Hayes. “Healthcare on its own can be notoriously complicated and stressful. Even the routine stuff, especially when you toss in some unexpected illnesses or accidents, can be a burden to navigate. Using technology to naturally provide personalized care – while delivering an experience that’s more approachable and predictable – will help put patients at ease and enable them to understand what they need to do to achieve better health. It gives them one less thing to worry about.”


That’s something everyone could use a little more of, these days.


Also read: Real People Tell Us What They Want From Healthcare In 2021

"This type of bot technology is providing great opportunities for healthcare practitioners and organizations to build trust and provide care that is truly valuable."

“There’s nothing more personal than your own health,” says Alyssa. “This type of bot technology is providing great opportunities for healthcare practitioners and organizations to build trust and provide care that is truly valuable.”


Our Chief Operations Office Ed Borromeo is also on the bot train. “It’s great to see this technology advance,” he says. “It provides so many opportunities to improve experiences within the healthcare space, overall – for both patient and healthcare workers.”


And the benefits aren’t exclusive to the healthcare industry. “We see increasing use of this class of innovation in a lot of other verticals: Banking, travel, even HR. Bots have a lot of utility and, frankly, they’re super cool. Beyond efficiencies, those who can seamlessly transition a bot user experience to, say, a human-to-human user experience with no clunkiness will be winners in the CX space.”


Note for all businesses out there: If your customers already explain their problems to bots, don’t make them repeat it when connected to human representatives. Make the changeover from robot to representative as smooth as a cut from a scalpel.

Walgreens Taps Microsoft & Adobe to Drive New Personalized Experiences For Shoppers

Walgreens is doing big things.


On the heels of an 18 month partnership with Microsoft, in which the two companies worked together to modernize technology and move their health-related operations to the cloud, Walgreens announced a second phase this past week – one that brings Adobe into the powerful fold to help craft next-level experiences and improve engagement with the store’s customers, both in-store and online.


By partnering Walgreen’s global customer data with Microsoft’s cloud-based data platforms and Adobe’s Customer Experience Management solutions, the trio will design holistic CX strategies that connect pharmacy, immunization, and retail interactions.

"Having a personalized experience like this can help customers feel like their time and business matters.”

One example of this is what they’re calling “individually tailored” prescription experiences: Today, customers are contacted numerous ways – by text message, email, phone call – when prescription refills are ready. In the near future, instead of being bombarded through multiple channels, none of which drive a valuable experience, they’ll receive an email that not only reminds them about the refill, but provides a “landing page” filled with information that encomapsses dosage, prices and other educational resources.


And since so much of a great customer experience is saving customers time, shoppers will also receive alerts that refills are available when inside Walgreen stores, so they don’t have to make a second trip later.


“Customers want to have your undivided attention,” says Alejandra Guillen, a Tallwave Content Specialist. “They want to feel like they matter and like businesses actually care about them. Having a personalized experience like this can help customers feel like their time and business matters.”


And Walgreens’ goal to connect their in-store and online experiences are key to sustaining customer affinity and loyalty.


“Before, in-store purchases were the gold standard,” explains Alejandra. “Now, especially with the pandemic, online shopping is becoming crucial. While people will always make in-store purchases, online shopping will continue to thrive even after the pandemic for convenience.”

One brand doing this well? According to Alejandra, Target.


“The Target app remembers your in-store purchases and combines them with your in-app purchases to deliver personalized deals and reminders to buy goods you have purchased in the past. This method is great for both an excellent customer experience and boosting a company’s profits.”


And last, but certainly not least, Walgreens’ new strategy to educate shoppers when reminding them about prescriptions will increase the bond and attachments customers have with them.


“Customers want to know what they’re buying and what they’re putting in their bodies. When it comes to prescriptions, no one is reading the long pamphlets that come with medications,” says Alejandra. “Formatting this crucial information into easy-to-understand landing page content will help customers build and establish longtime trust with Walgreens.”


Anyone else switching their regular pharmacy to Walgreens?

Categories
Strategy

Qualitative vs. Quantitative Data In CX Design: Everything You Need to Know

This is a common issue for many organizations, big and small, but it’s not an impossible one to solve!


If you’re experiencing a similar situation, you need to invest in gathering persona data that will not only tell you who your customers are and what they care about, but why they care and how they expect brands to make them feel.


To get started, let’s define each set of data, how it’s gathered and what it’s used for.


What is qualitative data?

Qualitative data – or primary data – is commonly gathered by businesses and plays an important role in understanding target audience sentiment and informing customer journey design. By conducting unstructured or semi-structured first-person user interviews, discussions, on-site observations, in-house moderated user testing, web analytics, and focus groups, qualitative data-collecting techniques allow companies to interact directly with their key customers, see how they’re using their products or services and receive feedback in real-time. It helps define the customer journey and establish an initial foundation and understanding of all internal and external customer experiences.


There’s just one problem: Sometimes people don’t know what they want, don’t have the words to truly express how they feel, or simply, aren’t honest.


That’s when quantitative data comes in.

Quantitative data enhances primary research and design efforts by quantifying key problem areas.

What is quantitative data?

Quantitative data – which can be gathered through a variety of structured surveys, questionnaires, and polls – is essential secondary research. When transformed into statistics, it enhances primary research (qualitative data) and design efforts by quantifying key problem areas. It also allows marketers, developers, business leaders and customer experience drivers to peer into customer details, attitudes, and behaviors from a data-driven standpoint, and test hypotheses established from qualitative data.

Qualitative Data vs. Quantitative Data: When Should You Use Each & How?

Let’s start with the when. To craft the best customer experiences, companies should collect and analyze both data sources on an ongoing basis. Because – and this is a big one – audiences and their expectations are always changing. By executing primary and secondary research to gather qualitative and quantitative data, companies make themselves better equipped to not only identify, but truly understand their customer base – how they interact, experience, and feel about a website, application or overall brand.


And don’t forget to gather employee input, as well! Employees are often the first to know what’s working and what’s not. Most organizations shy away from gathering input from employees, but in our experience, leveraging this powerful knowledge base sooner rather than later helps identify root challenges and opportunities to improve faster and more effectively.


Also read: Crafting Employee Experiences That Improve Customer Experiences


Now, the how. After both qualitative and quantitative data has been collected, follow these steps:

Map your qualitative data

Example of mapping internal & external qualitative data

Using the qualitative data gathered, map internal perspectives around critical touch points and test it against customer feedback that was collected. This should reveal discrepancies between what internal teams believe is important, versus what customers assign value to. By taking this qualitative approach, teams can visually display opportunities and challenges within the current experience. Providing a picture that illuminates the differences between internal and external stakeholder perception makes achieving cross-functional alignment on future plans easier. There’s not a whole lot to argue about when the writing’s on the wall.

Pinpoint exact moments of friction and/or leverage in your customer journey

Utilize quantitative methods via surveys and other previously mentioned techniques to analyze customer sentiment – opinions and responses – as well as perspective at every stage of the journey. Keep in mind, each interaction a consumer can have with your brand, both passive and active, is a touchpoint and part of your overall brand journey. Therefore, every interaction must be diligently and continuously monitored, evaluated and iterated because one singular touchpoint can cultivate customer affinity or aversion.

Pair quantitative customer sentiment with a qualitative understanding of the user journey

Pairing qualitative and qualitative data

Quantifying the customer journey creates a data-driven understanding of the critical inflection points that drive loyalty and churn. This naturally illuminates root causes of friction (or conversion!) and enable teams to be data-driven in problem solving and planning for future CX initiatives and investments.

How To Use Qualitative & Quantitative Data To Decide on Next Steps

At Tallwave, we create an ‘Impact Matrix’ – this tool highlights opportunities for improvement and compares the impact they’ll each have against the level of effort and investment they’ll require. This helps create alignment and buy-in for low-risk, high impact initiatives that are critical to shaping and improving the customer experience.


Find a similar exercise or tool to visually demonstrate all the opportunities that lie ahead and inform the build of a new strategic roadmap that can take your teams and company into the future.


Perhaps most importantly, don’t let perfection get in the way of progress! Making big system changes to your end-to-end user experience may take time, but avoid trying to solve it all at once. Identifying the biggest opportunities and making incremental improvements over time, while learning along the way, will make a huge difference.


Last but not least, don’t stop. This isn’t a “set it and forget it” game. Customer behavior – be it with an existing website, application or with a brand across numerous touchpoints – must be closely monitored to ensure both user and business goals are consistently met. If they’re not, all teams – Content Strategy, Product Development, People & Culture, Performance Marketing – must align to identify solutions for evolution and continue growth.


Also read: Why Customer Experience Can’t Be All Data-Driven

Don’t let perfection get in the way of progress! Identifying the biggest opportunities and making incremental improvements over time, while learning along the way, will make a huge difference.

Bottom Line

Let data be your guide. Qualitative input is key, especially early on, but also leverage quantitative data as much as possible to make decisions. The combination of qualitative and quantitative helps you identify where there is friction, but also gives you the context you need to develop solutions that hit the mark. And if you don’t have the right data infrastructure set up today, that’s a good place to start.

If you need help collecting, comparing and mapping your qualitative and quantitative data to improve your customer journey and overall experience, contact our team today!

Play Video

Bunger Steel

Doing some things and making some impacts