Categories
Strategy

Strategies For Pandemic-Winning Businesses to Maintain Momentum After COVID-19

2020 will go down in history as a year that vastly changed customer behaviors, expectations, and needs for good. And while that was bad for some industries and businesses, others whose products and services were ripe for digital-only and socially distanced environments saw major increases in customer acquisition, engagement, bookings, and overall sentiment.


For example:


  • Companies like RVshare & Cruise America saw an 846% increase in bookings, as homebound individuals and families sought out adventure and reconnected to nature.
  • Vacation and short-term rentals including AirBnb, VRBO, and AvantStay saw their numbers reportedly triple, and struggled to keep up with the demand.
  • Subscription services experienced immediate growth just weeks into the pandemic, seeing monthly customer acquisitions increase as much as 85%.
  • Grocery stores saw “double digit profits” compared to 2019.
  • The pandemic reshaped the fitness landscape as health and fitness equipment revenue more than doubled from March 2020 to October 2020.

But, as the world returns to some sort of normalcy and consumers begin to venture outside their homes, pandemic-winning businesses are forced to answer the question: What strategies will help sustain recent customer acquisitions and growth? As consumers get tired of doing things they were forced to do during the pandemic, and a resurgence of options become available, pandemic-winning businesses will have to rethink the customer journey and uplevel experiences to avoid their recent success from tapering off.

Business who opt to maintain rather than innovate and improve customer experiences, risk being left behind.

6 Ways Pandemic-Winning Businesses Can Carve a Path Forward

1. Identify Industry Changes & Trends That Will Continue Past the Pandemic

Understand what changed within your industry due to COVID-19, but more importantly, focus on identifying what the staying power of new and emerging trends really are. This will help ensure your business’s time, money, and energy is focused on creating change where it matters most, rather than reactively and wastefully catering to temporary trends that won’t drive long term ROI.


For example, according to an analysis conducted by the budgeting app TrueBill for The Washington Post, subscription boxes and services aren’t going anywhere. “Power subscribers” – consumers with 10 or more recurring payments that add up to an average of $145 spent per month – is growing exponentially. In fact, the subscription economy is predicted to grow by $1.5 trillion by 2025, says financial services firm UBS.


By understanding the staying power that subscription services have, you may be able to find ways to incorporate unique and convenient subscription-based experiences. Creativity is key. Take for example Tripadvisor. In an attempt to bounce back from hits the travel industry took during COVID-19, they’ve launched a $99 annual program that offers exclusive deals and dedicated service lines to subscribers as a way. Six Washington, D.C. restaurants found a way to play in the subscription economy by joining forces and creating a “supper club” that delivers gourmet meals prepared by different chefs each week to subscribers’ homes.


If there’s a will, there’s a way. And there’s a lot of money you may be leaving on the table if you don’t take time to identify trends that are here to stay.

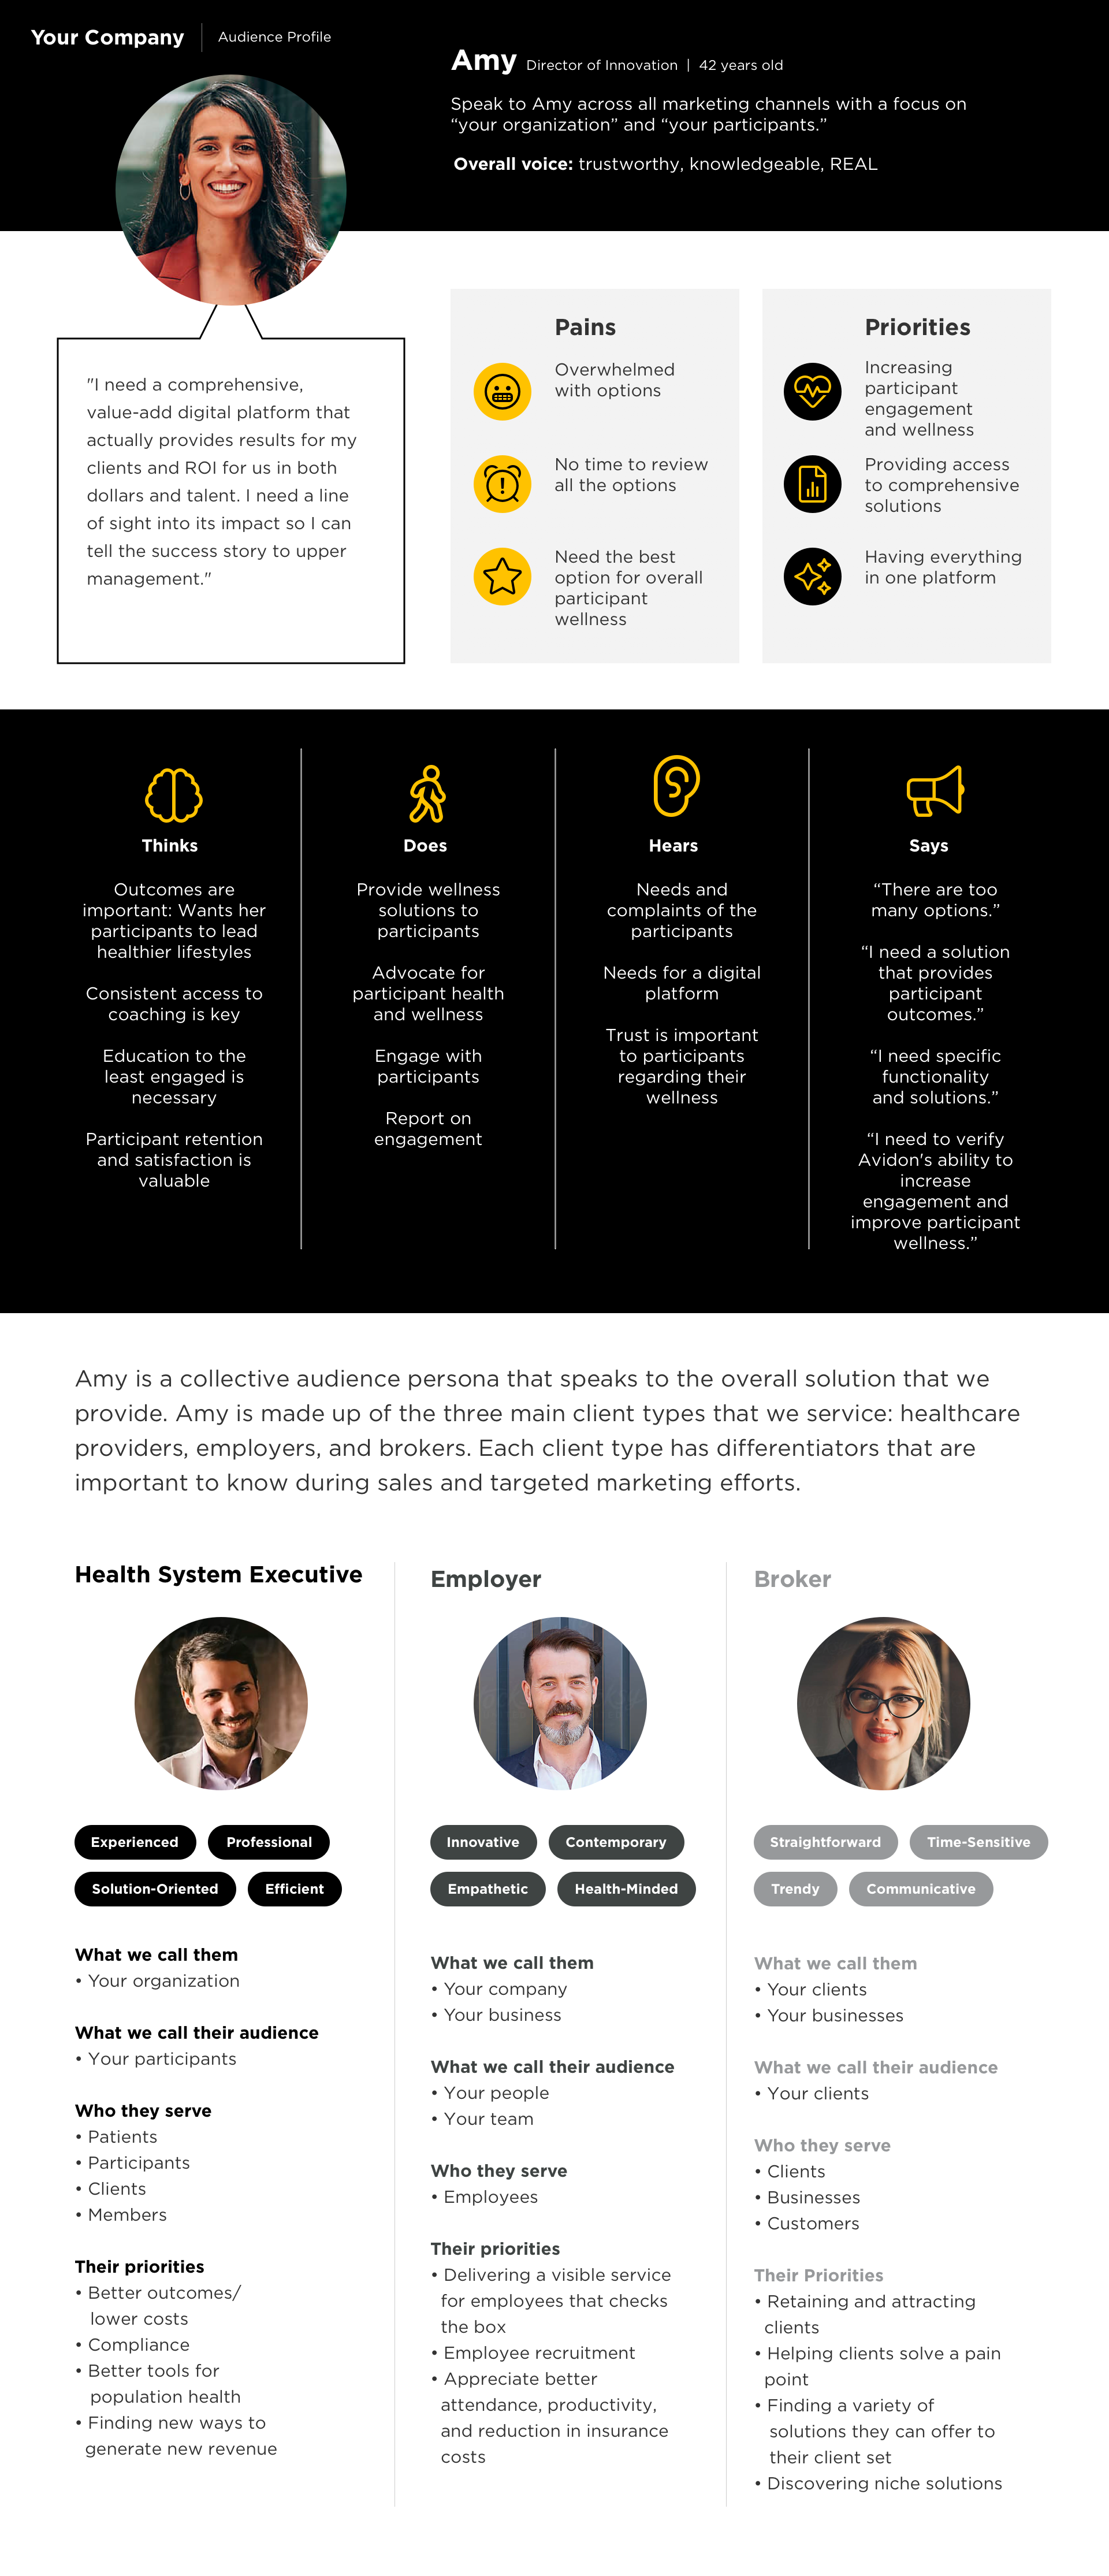
2. Reevaluate Consumer Groups & Update Your Ideal Customer Profile

Consumer groups have inevitably changed, due to COVID-19. Whether it’s just the needs and wants of your existing customers that have evolved, or you find that a completely new customer mix now engages with your products or services, it’s crucial to understand exactly who you’re serving, and how you can create better experiences for them in the future. By gathering and mining audience data, you can uncover new behaviors and update your core personas and customer profiles to inform future customer experience design.


For example, the experience and relationship restaurant owners need and want from their produce suppliers changed due to the pandemic. As part of a larger customer journey initiative to better understand everyday business needs and experiences of existing customers, we created and executed a customer survey focused on 1-2 restaurant locations segments for a food distribution company. The intent of the survey was to understand unique attitudes and behaviors that could provide more opportunity to focus on increasing share and loyalty, and to further understand segmentation differences within customer groups. By gathering insights directly from our clients’ customers related to technology and tools, COVID-19 impacts and competition, and perceptions associated with our clients’ existing services, we were able to update attitudinal segmentation within their customer mix and uncover future opportunities for improved experiences.


3. Consider New Customer Behaviors & Usage

With limited options during the pandemic, many customers found new ways to use products and services than originally intended. For example, many rental homes that were typically reserved pre-pandemic for short-term vacations turned into long-term homes away from home. Cars that were previously used to get from point A to point B became safe-havens and temporary escapes for overworked parents. Video communication softwares such as Zoom, Google Hangouts and Skype evolved from connecting business colleagues to hosting virtual game nights, happy hours, and family celebrations.


As you mine audience data to uncover new and update existing consumer groups and personas, it’s also important to pay attention to how behaviors or usage shifted during the pandemic. Did customers engage with your products or services in new ways? Were they seeking new results or using your business to complete unprecedented tasks?


Use this information to expand the customer experiences you provide by designing, imagining, or inventing new uses for your product or service that provide added value.


Also read: 6 Factors Influencing Customer Behaviors in 2021 (With Original Research)

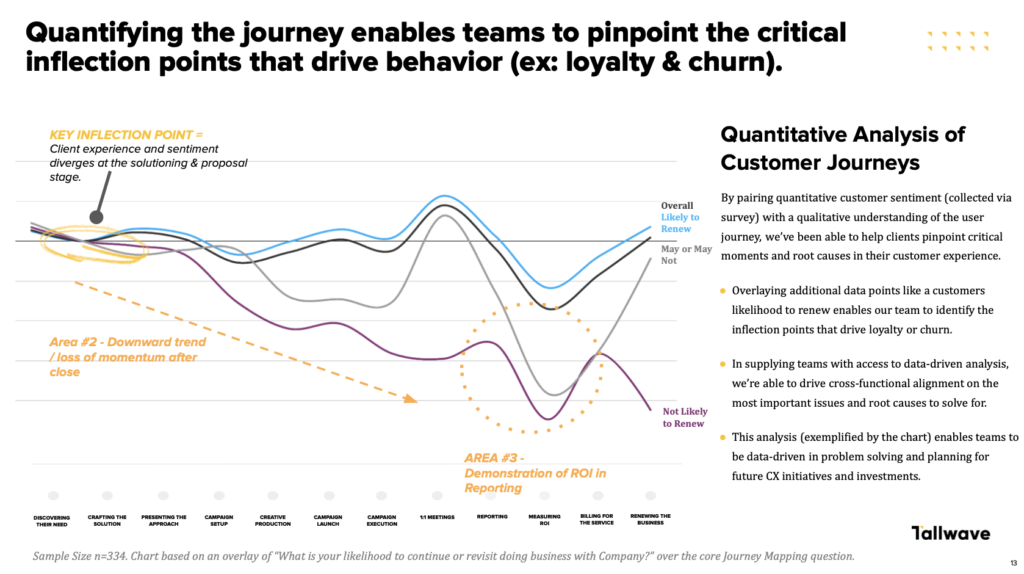
4. Pinpoint ‘Aha!’ Moments Within Your Customer Experience

The “Aha!” moment is when your customers truly “get it.” They understand the value that your product or service provides and realize why they need it – or simply want it – in their lives.


Evaluate and pinpoint where “Aha!” moments take place within your current experience by mapping the customer experience using both qualitative and quantitative research methods . Then, using the map, identify ways to either optimize, improve, or manufacture completely new “Aha!” moments to ensure continual value creation and engagement.


It’s important that customers perceive value at every stage throughout the customer journey to ensure repeat behavior. Don’t miss opportunities to drive an emotional bond and connection and establish a healthy customer-brand relationship by closing the loop too soon. The experience doesn’t end at the purchase point – the experience you provide creatively continue to drive value far beyond that.


Also read: 9 Quantitative Research Methods With Real Client Examples


Example of Customer Journey Mapping

5. Create New, Innovative, and Added Value For Customers

This is where we bring things full circle, and if you opt to maintain rather than innovate and drive your customer experience further, you’ll get left behind.


Through evaluating consumer groups and updating customer profiles, you may find that your business acquired new customers during the pandemic that wouldn’t have considered your product or services in a different time. As they start to return to pre-pandemic norms and habits, how can your businesses ensure you can convert newly acquired customers into repeat customers long-term? Well, using your customer experience map and analyses, look for ways to add value.


For example, new customers may not know how to use your product or service fully. If that’s not intuitive, you need to add value in the form of content (think opt-in texts, email nurture strategies, website quizzes and tools) or A.I. assistance to help customers use or leverage your product or services in new ways. By doing this, you can help educate consumers and push them closer to realizing value without selling them anything new.


Also, find ways to build community. Now more than ever, people are craving connection and want to support brands whose values align with their own and they can see themselves in. Consider connecting with and reaching new and existing customers by leveraging platforms such as Instagram, and TikTok to start conversations, allow people to attend offline events digitally, provide a look into your business “behind the scenes,” and more. The more authentic and human you can make your community and digital presence, the strong connection and support you’ll forge.


Also read: Developing Nurture Strategies That Decrease Time to Value 


Validation Strategy & Framework

6. Help Customers Navigate & Transition Into a Post-Pandemic Landscape

Lastly, be helpful. This is just another version of value, but in this case, it’s selfless. It’s not about acquiring, upselling, or converting. It’s simply about doing what’s right and holding empathy for your customers by extending value beyond the reason people are (or were) forced to use your products or services during the pandemic.


Play a part in helping them navigate the bounce back to pre-pandemic life in a way that feels aligned with your brand but puts the wellbeing of consumers at the core.


Need help envisioning and implementing strategies to maintain success in a post-COVID world? We can help. Contact us today.

Categories
Customer Engagement

9 Quantitative Research Methods With Real Client Examples

Quantitative research is essential to developing a clear understanding of consumer engagement and how to increase satisfaction.

Primary Quantitative Research Methods

When it comes to quantitative research, many people often confuse this type of research with the methodology. The research type refers to style of research while the data collection method can be different.

Research types

These are the primary types of quantitative research used by businesses today.

  • Survey research: Ideally when conducting survey research businesses will use a statistically relevant sample to understand the sentiments and actions of a large group of people. This could be their current customers or consumers who fit into their ideal demographic.
  • Correlational research: Correlational research compares two variables to come to a conclusion about whether there is a relationship between the two. Keep in mind that correlation does not always imply causation, which is to say you need to account for external variables that could cause an apparent relationship.
  • Experimental research: This form of research takes a scientific approach, testing a hypothesis by manipulating certain variables to understand what changes this could cause. In these experiments, there is a control group and a manipulated group.

Also read: 6 Factors Influencing Customer Behaviors in 2021

Data collection methods

Launching the above research requires creating a plan to collect data. After all, quantitative research relies on data. Here are the common primary data collection methods for quantitative research.


  • Surveys: A common approach to collecting data is using a survey. This is ideal especially if the business can obtain a statistically relevant sample from their responses. Surveys are often conducted through web or email questionnaires.
  • Interviews: Yes, interviews can be used to obtain quantitative data. While this form of data collection is typically associated with qualitative research, interviewers can ask a standard set of questions to collate formal, quantitative data.
  • Documentation review: With an increasing amount of business occurring digitally, there is more documentation now than ever before to help inform quantitative conclusions. Businesses can assess website metrics such as return visits, time on page or even use a pixel to track customer movement across websites. They can also view how many times their app has been opened and actions users have taken on their platform to determine customer engagement.

Secondary research can be helpful when formulating a plan for obtaining primary quantitative data. It can help narrow areas of focus or illuminate key challenges.

Secondary Quantitative Research Methods

Secondary data is information that is already collected and not necessarily exclusive to the company but still relevant when understanding overall industry and marketplace trends. Here are a few examples of secondary data:

  • Government reports: Government research can indicate potential regulatory roadblocks, customer pain points and future opportunities. For example, a fitness company might use government data that shows an increase in use of outdoor running trials to develop a new product used to meet that specific use case.
  • Survey-based secondary data: Polls or surveys that have been conducted for a primary use could be reused for secondary purposes. This could include survey data obtained by other companies or governments.
  • Academic research: Research that has been previously conducted and published in peer-reviewed journals can help inform trends and consumer behavior, even if it doesn’t apply to a company’s specific customers.

Secondary research can be helpful when formulating a plan for obtaining primary quantitative data. It can help narrow areas of focus or illuminate key challenges. It can also help when it comes to interpreting primary data, especially when trying to understand the relationship between two variables of correlated data.

Also read: The What, Why, & How of Customer Behavior Analysis

Real Examples of Quantitative Research

We regularly use quantitative research to help our clients understand where they can best add value to increase customer engagement. Here are three examples of quantitative research in motion.

Example 1: Leading food distribution company

We helped a leading food distribution company identify changes in the needs and values of their restaurant clients as a result of COVID-19. This helped inform opportunities to become more valuable partners.


The research plan involved creating a survey that was emailed to clients. The questions were specific and numeric. For example, respondents were asked what percentage of their weekly spend was used with the food distribution company. They were also asked to assign a percentage to the way their food ordering had changed during COVID-19 and to rate their satisfaction with the food distribution company.


The results showed changes that had occurred for clients of the food distribution company as a result of the unique stressors of the pandemic. We were able to determine changes in weekly food supply and customer count as well as menu adaptations and purchase behavior.


Example 2: Leading credit card company

Our work with a leading credit card company required us to understand what current travel card members valued about the rewards program and their preferred communication method for booking travel in order to create an omnichannel servicing strategy and ideal customer journey.


Through an online survey of younger cardholders, the target demographic for this project, we asked questions such as length of card membership, total spend and the number of annual leisure trips in addition to more specific questions that showed how members get inspiration for trip planning and where they research.


The results highlighted ways to overcome resistance to pricing by proving more value. It also illuminated ways to make the benefits of membership more tangible to card holders and how to influence travelers in the early stages of planning their journey.

Example 3: Internal research report

We’re in the business of drinking our own champagne, so to speak, which is why we conducted our own quantitative research aimed at understanding the consumer trends that were spurred by the pandemic and how these will transform behaviors in the future.


There’s no question that new customer experiences emerged from the pandemic. Think of offerings such as “buy online, pickup in store (BOPIS),” or blended restaurant meals that are cooked at home. We wanted to understand how consumers truly felt about these new experiences and which they were likely to continue using even after restrictions were lifted. We also wanted to know more about the changing expectations for branded communication and how all of these pieces of the puzzle fit together to create consumer engagement. Our method of data collection was a survey.


Our research led us to develop insights we could use to inform our customers in their decision making. For example, we found convenience is paramount for consumers who are seeking out hybrid experiences such as BOPIS to take the best of both worlds. We also found many of these changes are permanent as consumers embraced new experiences that made their lives easier.

We regularly use quantitative research to help our clients understand where they can best add value to increase customer engagement.

The Bottom Line

Quantitative research is essential to developing a clear understanding of consumer engagement and how to increase satisfaction. Though online surveys are one of the most common methods for obtaining data, research isn’t limited to this strategy. It’s important to use whatever strategies are within your scope to constantly evaluate new trends and consumer behaviors that could significantly impact your offerings. The results can show you how to re-engage customers and drive loyalty.


Interested in partnering with us to learn more about your customers needs, wants, and behaviors to inform future experience design? Contact us today!

Categories
Customer Engagement News Reaching New Customers Strategy

Stabilizing Your Facebook Advertising Strategy Post-iOS 14.5 Release

On Monday, April 26, Apple released iOS 14.5, the first version of the operating system to enforce Apple’s App Tracking Transparency (ATT) policies. ATT requires iOS users to opt in to share their unique Identifier for Advertisers (IDFA), a randomly assigned user-specific identifier with app developers. This would, in turn, allow advertisers serving ads within those apps with the data needed to personalize ads and track performance across platforms, from view to click all the way through to conversion. In anticipation of this change and other privacy regulations, players across the digital advertising space have been responding with changes of their own. Most notably, Facebook has made significant changes to its conversion tracking and application settings.

A month after the iOS 14.5 release, opt-in rates for US-based users is sitting at 6% and Facebook advertisers are starting to feel the effects in the form of increased conversion costs, loss of attribution data, and new challenges to ad targeting and lookalike audience building. If you’re grappling with the impacts of the iOS 14.5 release and ATT enforcement on your Facebook ad campaigns, here are some key considerations and recommendations to help you navigate through the immediate challenges and set a course for a smoother road ahead.

Facebook users are a no less valuable audience to your marketing strategy now than they were before.

Stabilizing Steps to Take Today

Secure Ownership of Your Facebook Accounts

Previously inherent capabilities to track movement between your website and Facebook will no longer be available and pixels previously put in place to support user targeting and conversion tracking will no longer be as effective. This is where ownership over your Facebook account and business website become critical. In the past, agencies have commonly created digital marketing accounts for clients – including Facebook Business Managers and ad accounts – under agency ownership. The benefits have been increased speed, reduced burden on clients who may not have resources available to manage account setup, and the benefit of agency history with the platforms, which eliminated spend thresholds and other speed bumps in the path of rapid execution and performance. The implications of iOS 14.5 have created the need to shift ownership from agency to business in order to reconnect some critical dots:

  • Your Facebook account and business website can’t effectively speak to each other until your website is claimed through your Facebook Business Manager account. This will allow cross-platform performance tracking and change how your web links appear on your Facebook page. This is also a requirement for configuring conversion events, which are used by Facebook’s machine learning to drive better targeting, optimization, and performance measurement.
  • The Facebook Conversions API can be put in place to enable tracking and optimizing for conversions outside of Facebook, like purchases made on your website or a Shopify account, among others. It can also mitigate the effects of losing access to 28-day click, 28-day view, and 7-day view attribution windows, which will no longer be supported. However, the API cannot be implemented when ownership of Facebook pages, Business Manager accounts and ad accounts are split between business and their partner agencies.

Keep a Customer-centric Focus

While the ability to track based on audience behaviors may be changing, the behaviors themselves are not. If you were finding success with Facebook users before iOS 14.5, resist the urge to move away from Facebook based purely on trackability. The known habits, behaviors, and preferences of your audience should always be the guiding force behind your marketing mix. Bottom line: Facebook users are a no less valuable audience to your marketing strategy now than they were before. What’s changed is the way users are tracked and attributed and how to interpret the value of that data.

Also read: Data Driven Insights Into the Evolving Customer Experience

Consolidate Campaigns and Conversion Events

With Facebook shortening attribution settings to 7-day click and 1-day view by default, fewer conversions are being tracked and more scale will be needed to move ads through the learning phase toward performance-driving optimization. The larger the number of campaigns, ad sets, and ads businesses are running, the fewer impressions served and conversions achieved, making it harder to hit an even higher bar for scale. Consolidating campaigns, ad sets, and ads as much as possible will create efficiencies during the ad learning phases, helping drive performance more quickly.

Additionally, advertisers will need to consolidate and prioritize the events being tracked within Facebook’s event manager. Domains are now limited to no more than 8 website conversion events. If your campaigns are being optimized for more than 8 conversion events across the same domain, you’ll need to narrow down to the 8 or fewer conversion events most critical to your marketing objectives and configure them in Facebook’s Aggregated Event Measurement tool. Once your 8 or fewer conversion events have been selected, they must be put in priority order with the most valuable action first and the least valuable action last. The priority of the events will come into play when and if a user takes multiple actions with the 7 day conversion window. For example, if a user adds a product to a cart (achieving one conversion event) and leaves the site without completing the purchase only to return the next day after being served a retargeting ad and completes the purchase at that point (achieving another conversion event with a higher priority), the purchase event will show in Facebook’s event manager and the add to cart event will not based on the priority set. Thinking through the conversion events that are most important and their order of importance will help ensure Facebook continues to be an effective lead- and revenue-driving channel despite the latest changes.

Expectations for performance are going to have to change.

Recalibrate Your Goals

Expectations for performance are going to have to change. CPAs and CPMs on Facebook are on the rise and the increase is likely to continue as advertisers grapple with the previously unknown impacts of iOS 14.5 and the corresponding ripples through Facebook. Those who can stay the course, test new approaches, and adapt how they think about, interpret, and apply data to optimize performance will continue to find long-term value in Facebook as part of their marketing mix. And as advertisers who can’t adapt pull back from the platform, those who remain may find themselves in a less competitive environment over time.

For many businesses, especially those with sales cycles that extend beyond Facebook’s pre-iOS 14.5 28-day attribution window, there were always gaps in the data. To help fill some of the gaps within Facebook’s reporting capabilities, ensure you are implementing best practices for tracking, like adding UTM parameters so that you can track ad and campaign performance and conversions within Google Analytics. In addition to a narrowed attribution window, reporting delays of up to three days will make short-run campaign optimization challenging and breakdowns based on age, gender, region, and placement for delivery and actions will no longer be available, necessitating a different approach to campaign optimization. Creating benchmarks based on the most reliable data points you have and adjusting your performance goals based on that data will help steer campaigns in the right direction. Similarly, stepping back from channel-level performance goals and focusing on incremental impact to business goals (i.e., how much incremental lift you’re seeing in sales, revenue, new customer acquisition, etc.) will help you evaluate the impact of your channel-level investments in a more meaningful and sustainable way.

Categories
Reaching New Customers

6 Factors Influencing Customer Behaviors in 2021 (With Original Research)

With fast-evolving customer experiences and technologies rolling into the market what feels like everyday, only one thing seems to consistently remain the same: Consumer behaviors, expectations, and needs never stop changing.


Cultural, social, personal and psychological forces influence what consumers do and why. And as consumer behaviors change, marketing strategies must change, as well. But for brands and businesses to craft the customer experience that can lead them through the next frontier of business, they must first understand what customers are truly prioritizing.

Better marketing comes from better understanding consumers.

According to our recent research report, here are the top six factors that are changing the customer experience design game today:

1. Convenience

Convenience is consistently the most significant way consumers are evaluating companies post-pandemic. It turns out that consumers like some of the adjustments they had to make as a result of the pandemic. For example, 31% of those surveyed said they will still use grocery delivery services even after restrictions are lifted in their area. Consumers want purchases that are easy to make. That doesn’t stop at simply digitizing offerings. It also means upgrading customer service experiences so consumers can get help when and where they want it.


Keep in mind that consumers aren’t necessarily looking for virtual-only experiences. They are keen to combine the best of digital and personal touchpoints to do whatever is easiest. That’s why “buy online, pick up in store” (BOPIS) has become popular. A total of 68% of our survey respondents indicated they have tried this approach, two thirds say it made them feel somewhat or more positive about the company that provided it. That’s because convenience rules the day. Companies that can blend the best of their offerings to create the most streamlined experience are winning post-pandemic.

2. Safety and Well-Being

Most age groups we surveyed indicated that safety and well-being are a major factor in their decision-making process. Excluding Gen Z, every other age group voted safety as their second biggest concern. Safety and security— both physical health and data— must become the standard operating procedure for businesses. Cleanliness and a focus on well-being are no longer extra steps that businesses are taking during “unprecedented times” but the expectations that are leading the way in every customer experience.

3. Immersive in-person experiences

The decline of physical retail shopping has accelerated in the pandemic, but marketers have found a way to bring customers in-store to develop loyalty: experiences. The concept of retailtainment has been gaining traction, with 52% of millennials saying they spend on experience-related purchases. Experiential marketing is more important than ever, especially as customers emerge from the pandemic and are hungry to make up for missed experiences.


In the digital-first world post-COVID, a lot of general shopping will be ordered via recurring subscriptions or deliveries. Capitalizing on the appetite for experiences, businesses can entice customers to come in-store with valuable experiences that educate and connect. As a bonus, a truly immerse experience can help earn coveted word-of-mouth and organic social presence.

The pandemic has highlighted social inequalities in daily life and consumers are choosing to vote with their pocketbooks to create change.

4. Social Responsibility

Customers are increasingly loyal to brands with a conscience, especially as the global pandemic has hindered the well-being of so many people. It’s clear that customers expect brands to lead with kindness and empathy, even at times using their resources to fill gaps left by local governments or to support social causes.


In a survey that assessed consumer perceptions of corporate social responsibility, three out of four respondents said that the way a company looks after their customers and employees during COVID will impact their loyalty to the company post-pandemic. The pandemic has highlighted social inequalities in daily life and consumers are choosing to vote with their pocketbooks to create change.

5. True and Ongoing Value

It’s clear that consumers are even more sensitive to value realization now than before the pandemic (learn about value realization here). At some point during your customer’s journey there will come a time when the value of your product or service is fully realized. This can set the tone of the future of your customer’s experience with you. Not only do they need to see value early, but it needs to be consistent throughout their lifecycle in order to increase your customer lifetime value.


Also read: Developing Nurture Strategies That Decrease Time to Value


Wary of a possible recession in the wake of the pandemic, in addition to increased inflation, consumers are prioritizing the value you bring before they’ll part with their hard-earned cash. Your products and services need to be well-priced and solve a real problem. Premium add-ons are less of a priority for consumers, unless they target other specific desires such as social responsibility or safety. 

Ratings and reviews help build this confidence in a way that feels legitimate to wary consumers.

6. Trust and confidence

Third-party and peer recommendations are deeply integrated into the buying process, especially post-pandemic. New data rates rankings and reviews as the number one most important factor impacting purchase decisions, above price and even free shipping. Nearly one in two customers read between one to 10 reviews before making a purchase decision, and 68% of customers say they prefer products with at least 26 reviews.


It’s clear the pandemic has caused consumers to lose some faith in traditional institutions and they are consistently relying on communities of like minded people to act as thought leaders. Ratings and reviews help build this confidence in a way that feels legitimate to wary consumers.

Bottom Line

Synthesizing all of these consumer changes to carve a future path requires companies to take a strong look at their to take a step back and understand the problem they are trying to solve, the “why” behind reimagining their products and customer experience. This can help realign with what consumers are expecting today. We walked through this same process with a leading travel brand, taking the time to define what it means for them to be in the travel business in the first place. Using those answers, we were able to define success. Then, we looked at what changes would be in scope for the brand. You might not be able to accomplish everything you dream of or know customers want, but defining changes that are within your ability is a good first step.


Implementing changes is the purpose for all of this research and brainstorming, which is why the last step of the process is understanding what partners will be necessary to help innovate. Iterating on your products, services, and overall customer experience isn’t easy and making cross-functional changes can be challenging, but given the massive shifts in consumer preferences post-pandemic, it is more important than ever to understand these factors and adjust to ensure value realization.

Need help understanding your current and future consumer’s needs? Contact us today

Categories
Customer Engagement

Developing Nurture Strategies That Decrease Time to Value

Whether you’re nurturing prospects or guiding product qualified leads through a free trial, intentionally crafting their journey allows you to coach potential buyers toward a purchase decision. Weak points in your nurture could be the cause of a low conversion rate.

Understanding the mechanics of a great nurture hinges largely on the concept of time to value (TTV), which refers to the time between when a customer takes an action and when the value of that action becomes obvious to them. TTV can help you diagnose where your nurture might be weak. For example, if you’re seeing low conversions from your free trial, it could be the case that your TTV is actually longer than the trial itself. This concept could apply to many points in the customer journey. Marketo found that 96% of website visitors aren’t ready to buy based on their initial visit. That’s when nurturing strategies come into play. Your nurture strategy helps to move customers through the marketing funnel with touch points that help communicate the value your product or service provides.

Tweaks to the nurture strategy can improve the customer experience and increase customer engagement and conversions. We worked with a SaaS company to revamp their nurture strategy to do just this. Originally, their customer onboarding experience had an ambiguous timeline and the high value actions weren’t made clear. We recommended changes that pivoted to an action-based nurture that reduced friction and personalized touch points. By identifying three critical stages in the trial onboarding period, we divided actions between what we called work, play and commit. We then frontloaded the sign up friction in the work stage. That allowed us to reduce the TTV and move customers through the play stage and toward commitment.

Also read: Uncovering the Root Cause of Low Conversion Rates to Unlock Continual Growth

If you’re trying to improve your customer nurture journey, there are some key best practices to incorporate. Here’s what to know.

Best Practices

Statistics show that 74% of companies are prioritizing improving conversion rates over the next 12 months, indicating this is a more important business need than driving traffic to their websites or even increasing customer lifetime value.

Here’s what to keep in mind if you are looking to revamp your nurture strategy to optimize your conversions and increase customer engagement:

  • Personalize: No one wants to feel like they’re receiving a cookie-cutter message from you so take the time to personalize your messaging based on customer actions. This goes beyond simply addressing them by name and takes into consideration where they might be in the journey.
  • Segment your lists: You can’t personalize if you aren’t segmenting, so be sure to divide your list by specific data points. There are many ways you can do this beyond the basic demographics of age and gender. You can create segments such as location, transaction history, web browsing history, and even device type.
  • Get creative and specific. Create multiple touch points: You should think of your nurture as greater than just one email. Consider all the channels you can use to nurture your customers — email, text message, retargeting ads. Make your communication ecosystem work together to create a world that pulls your customer in.
  • Include a call-to-action: In all your messages there should be a clear call-to-action that helps your customers understand their next steps. Keep it short and compelling.
  • Split test: Develop the practice of being data-lead by A/B testing all of your messaging. It’s hard to be entirely sure which subject line, call-to-action or topics will resonate with your audience, so let the data lead the way.

No one wants to feel like they’re receiving a cookie-cutter message from you so take the time to personalize your messaging based on customer actions.


Validation Strategy Framework

Make your communication ecosystem work together to create a world that pulls your customer in.

Product-Focused Campaign

Educate potential customers on everything your product can help them achieve with a product-focused nurture that highlights your most important features.


Purpose: Become a trusted thought leader for your prospects as they advance through the sales cycle.


Strategy: Highlight features that solve pain points using case studies, white papers, and internal data.


Success metric: You’ll want to determine if customers are using the specific features you’re highlighting for them in your nurture. This can tell you if the features you’re explaining are resonating with them or if you need to find more relevant features for their goals.

Competitive Campaign

A competitive campaign is more aggressive than other nurtures on this list. For this type of a nurture you’ll get specific about what differentiates your product, and what users have to lose if they choose one of your competitors.


Purpose: If you have a main competitor that customers are constantly weighing against you, a competitive campaign can work to overcome their objections by educating them about how you are better positioned to help them achieve success.


Strategy: Use specific information gathered during sales calls to address main objections without coming across as negative. Any press you’ve obtained or industry intelligence that proves your worth can be helpful here.


Success metric: Count actions such as signing up for your trial or upgrades to determine the success of this campaign.

Promotional Nurturing

Promotional nurturing can help move prospects across the finish line with a limited time, exclusive offer that encourages them to act now.


Purpose: Promotional nurturing helps you close a sale when you are in the purchase stage of the cycle.


Strategy: If you’re working with a big account that could significantly impact your business, offer special pricing or access to upgraded features based on what you know their needs are. For smaller accounts, adding a discount to your email nurture toward the end of the trial stage can inspire users to upgrade.


Success metric: For account-based selling, assess how many times you are able to close the sale. For product qualified leads, review how often your discount code has been used.


Also read: Optimizing paid media strategies to continually increase leads year over year

Your goal should be to help your customer get the value they are seeking faster by sending the right message at the right time.

How to Assess & Redesign Your Nurture Strategy

Improving your nurture strategy starts with assessing user behavior to identify where you can aid with value realization. This might include collating more data on your users so you can do a better job segmenting your nurtures. It could also include competitive research that helps you identify other journeys your users might be experiencing as they compare your service.


Use this research to map your entire customer conversion experience to identify opportunities to increase customer engagement. Then, identify gaps in content and specific trigger points that could reduce the time to value. If you find quick wins, implement these immediately while preparing your campaign overhaul.

The Bottom Line

There are so many ways you can nurture your relationship with your customers to increase engagement, prove your value and turn trial users into paying clients. The key to it all is constantly iterating by using data to understand what your customers are experiencing at each step in the journey. Customizing your messaging to respond to their actions and experiences will help you personalize each nurture touch point, increase customer engagement and prove the value of your product or service.

Categories
Innovators Series

Innovators Q&A: How Banner Health’s Digital Marketing Strategies Increased Customer Trust During COVID-19

As soon as COVID-19 hit, healthcare systems and organizations across the world scrambled to craft new strategies to serve their communities whilst keeping employees and patients safe. But despite their efforts, there was often one barrier that often prevented patients from seeking care in times of need: Trust. Trust that they’d be protected from contracting COVID-19, should they visit a hospital in-person.

In the latest episode of Tallwave’s Innovator Series, our Vice President of Marketing Jessica Pumo talks to Patrick Knauer, the Director of Digital Marketing for Banner Health’s Ambulatory practices, about developing and implementing digital marketing strategies to give patients peace of mind, as well as what he believes is in store for the future of healthcare, the patient experience, and digital marketing as a whole.

Innovators Q&A With Patrick Knauer

Jessica Pumo: Hello everyone. I’m Jessica Pumo, Vice president of Marketing at Tallwave, a customer experience design company. Welcome to the latest installment of our Innovators Series. Today, I am thrilled to be joined by Patrick Knauer, Director of Digital Marketing for Banner Health Ambulatory Services. Welcome, Patrick.

PK: Hi Jessica. Thank you. It’s great to be here.

JP: Now, at a high level, Patrick, you work with Banner Health’s ambulatory service lines to align marketing strategies to business direction, and then you work with the broader marketing and media teams to execute marketing campaigns. So, I know you’ve got great perspective to share.

To kick things off today, I’d just like to start by hearing a bit about your professional journey. What initially attracted you, like so many of us, to digital marketing, and how did you get to where you are today?

PK: Yeah, I started off in digital marketing, working for a search engine optimization company, not knowing how much I would love it, but it really became my passion just because it changed it. It felt like every two weeks Google would reset the landscape and we would always [have to] adjust and have to rethink our approach.

That sense of excitement really stuck with me as I grew and it’s still that way. I’ve been in digital marketing for over 15 years now and it does feel like every two weeks there is a new tweak to keep you on your toes. So, that excitement hasn’t faded.

JP: So, let’s get a little more specific about how your role contributes to Banner’s larger mission. How is success defined for you and your team and how does that help Banner reach its established business goals?

PK: Yeah, so, Banner is working to meet consumers where they need healthcare, and that’s in an ambulatory setting. My role and the teams that I work with, are working to make sure that we’re easily accessible. That we’re easy to find through digital channels and that when our consumers need care, it’s not troublesome or burdensome to schedule to get into a healthcare clinic and to get out.

So, we have a lot of communication that we need to do, and we have a lot of marketing that we need to do to make sure that we’re omnipresent on various digital platforms that consumers use today.

There was a fear about being inside small spaces and healthcare locations. People were more hesitant to just walk in. They wanted to use their digital tools to limit their time, to limit their exposure, and [to] make that appointment on the computer.

JP: Wonderful. As, as we narrow our focus a little bit, I think I’d be remiss if I didn’t start with something that I know has changed the landscape for all of us. And it must be an understatement to say that the pandemic has changed the healthcare landscape.


So, given that the pandemic has driven a lot of changes to how consumers find and engage with businesses of all kinds, what kinds of changes have you all seen in terms of how consumers search for and engage with ambulatory services?


PK: One of the best examples that I could give you would be just our online appointment rate for our Urgent Cares, which is of our ambulatory service lines. We see the most volume out of our Urgent Cares. We have over 50 locations in Northern Colorado, [and] Arizona, so a lot of different points of access.


And, what we noticed from the beginning of the pandemic to its peak, was that our online bookings rose by 37% [percent] all the way up to 50% [percent]. So, about half of the patients coming through the doors were scheduling online. And the reason we saw that increase was because there was a fear about being inside small spaces and healthcare locations. People were more hesitant to just walk in. They wanted to use their digital tools to limit their time, to limit their exposure, and [to] make that appointment on the computer.


JP: Since you’ve mentioned it, I would love to jump to that idea: How concerns around personal health and safety have changed with the pandemic.


I know that’s really put those concerns front and center and the need to build trust with consumers has never been more important than it has been just these last several months. This need must have been even more acute when it comes to ambulatory services.


So, I’m curious what data points have you used to help understand patient needs and patient pain points as they’ve evolved through the course of the pandemic?


PK: Our analytics demonstrated that, prior to COVID, the most popular action that we would see consumers takes were clicks over to our website where they could access more information on the location or the services that were there.


But during the pandemic clicks to the website went down and direct phone calls to our clinics went up… We extrapolated from that there was more information that they needed directly from a person: To hear what steps were being taken or specific situations – if you’re at high risk for COVID or you have an auto-immune disease, or you’re in a certain age bracket – you might need reassurance of talking to someone at the front desk, and asking questions [such as], “Can I be seen?”, “What special requirements or services do you have for me?”


That was one data point that we really noticed, and it helped to kind of informed the communication that we put out there to our consumers because we were able to take those data points out of the conversations and understand, what are the concerns? How do we address them [and make] them easy to find, and put them in front of our consumers so that they already know the answers to some of their questions?


Also read: Data Driven Insights Into the Evolving Customer Experience

There’s a myriad of different digital transformations that are happening, but most of them are revolving around improving the ease and the experience.

JP:  It’s really fascinating to hear how you’re looking at those digital signals and interpreting them as indicators of how that experience needs to change, knowing that the experience inevitably – in an ambulatory setting – is going from online to in-person. How has Banner worked to build patient trust through marketing and messaging from what they experienced in local search to what they experienced when they arrive in-person at an ambulatory services center to inspire and build that confidence and trust and drive continuity in that experience?

PK: That was the main challenge with COVID. And the main objective was to really make sure people understood the efforts that, as an organization, Banner Health was taking to make care safe.

So, we created a safe place for care, a logo, and a brand campaign… [We put that logo] on communications, whether it be a top of the funnel advertisement or bottom of the funnel, actually inside the clinic. We had the steps we took to clean a clinic, that we ask our patients to [wear a] mask, and the other steps that we take for our own employees to make sure everyone [is] safe. And we put those pieces of communication on our website, on our blog, within our emails – all over the possible digital touchpoints, so that no matter where the consumer interacted with Banner, the logo was there and the information was there. And if they needed a deeper dive, we provided the URL where they could go and read exactly the steps that we were taking behind the Safe Place For Care campaign.

JP: When you look at any one of those individual touch points, the changes that you’re describing may seem really nuanced, but when you look at them in [the] aggregate, that really is some significant changes to the patient experience.

PK: It really was. And it was a lot of work to spread that kind of communication across 400 plus clinics, [through] email, blog, or website advertisement. But that was our mission. That was our objective. I was proud to be a part of the team, and the outcomes were great because we had a lot of people tell us that they felt safe, and they appreciated the efforts that we took.

JP: Which is so important. So important. Well, let’s move from innovation to transformation here for just a second. Something that’s top of mind for me and for the Tallwave team, based on our recent Tallwave research report, is telehealth as a prime example of the digital transformation underway in the healthcare space. What does digital transformation in healthcare look like for you and your team?


PK: It looks like a lot of things. That’s a difficult question to unpack because it could be an app on the phone that has a host of capabilities – from communicating with your provider to accessing lab reports, to making an appointment. And that’s just within an app. But there’s also other touch points out there, on the web on a mobile web, where you need to have other capabilities like online scheduling.


One of our most popular digital transformation features is our symptom checker, which is really easy to use. You can just pop onto BannerHealth.com, open up the symptom checker app, tell our computer exactly what you’re experiencing: What you’re feeling, [and] what your symptoms are. And after a series of questions and answers, you get a mini-diagnosis, and it’ll point you to the right level of care, which is important in healthcare, because you don’t want to go to the emergency room when an urgent care visit is perfectly appropriate.


There’s a myriad of different digital transformations that are happening, but most of them are revolving around improving the ease and the experience, overall, that you have interacting with healthcare.


JP: I know we’ve talked about some of the complexities of managing that experience within the pandemic, but I certainly don’t want to lose sight of how complex that is for you and your team, just on a day-to-day basis.


In general, outside of the pandemic, I know Banner has leveraged a really diverse constellation of digital touch points to address patient needs and pain points by meeting them where they are, when they’re there. And I know that really does cut across a lot of different teams at Banner. So, how do you set the stage for smooth handoff, from your team to the next, so that that patient experience feels really seamless as they move through multiple points of engagement from the Banner websites to social, to email, to Google My Business, and everything in between?


PK: Yeah, that’s one of the core responsibilities of my role. As the Director of Marketing for our ambulatory service lines, I need to understand the objectives of one of our business units, like Urgent Care or the medical group, and come forward with a marketing plan that meets the goals that they’re trying to accomplish.


Then, I put that together into what we call a marketing playbook, which lists out: What are we trying to accomplish? What are our goals? What are we going to use as our call to action? What are our proof points, or what we like to call “reasons to believe” in Banner Health or Banner Urgent Care or Banner Medical Group. [I] put that into a centralized tool, which we use work from, and pull all of the various teams together and have kickoff calls, and installation meetings, and go over all of this planning [around] the direction, and everything that we are going to use so that everyone understands: “Let’s use these calls to action. Let’s use these reasons to believe. Here are blog resources. Here are website resources.”


And then, whenever it’s time to actually execute, the teams can go into [that] work, [and] know that they can pull the information [and] that will be the same information that the web team is pulling, or the email team is pulling, and the advertising team is pulling. So, everything is the same across the board, and you have that nice, beautiful experience that’s consistent.

We know that the level of trust that we encounter through Google My Business and organic search is higher just based upon the way our consumers convert and make those appointments – but paid search is a very high converting platform in itself.

JP: I think you you’ve touched on some things that really are very actionable for all of us. I think there are very few marketers out there who are not working hand-in-hand with other marketers who may be on different teams, different departments, different divisions, but the idea of starting with a really clear unifying strategy in enrolling everyone into that strategy together, so that you’re all on the same page, and then offering up the tools and resources that everyone needs to do the job. I know it sounds simple. It’s hard to execute and certainly worth bearing in mind. So, thanks for calling those things out.

As a marketer who manages a combination of paid search and organic search, which are needs supported by different teams in my world, it’s not lost on me how challenging it can be to marry those things. That really should be two parts of a whole. So, I’m curious, Patrick, how do you think about organic versus paid search as it relates to the patient experience, and how do you coordinate your efforts on the organic front with those of your partners managing the paid activity so that those things work together?

PK: I think they’re both extremely valuable and, in my mind, there’s not a difference between the two. There’s performance differences – we know that the level of trust that we encounter through Google My Business and organic search is higher just based upon the way our consumers convert and make those appointments – but paid search is a very high converting platform in itself.

The thing that we want to do is make sure, again, that our messaging is consistent, that we’re using the same reasons to believe, because we know from analysis of how long it takes some to convert, that there might be multiple touch points along the way. Paid search might be two of three touch points. So, we want to make sure that the messaging, the reasons to believe are consistent no matter where they interact with us. But from a strategic level, they’re both lower funnel for us. And they’re both of high importance,

JP: [It] all kind of goes back to recognizing that those things have to be seamless in the customer experience. Right? So, how do you see local search within the ambulatory services space changing and how is your team adapting?

PK: So, yeah, I think that’s an interesting question. Real estate in Google is shrinking, and Google is owning more of the first page for its own products, like Google My Business, for zero click information. I think that that’s going to continue. I think paid search is going to stay rather consistent with the results that you see on the page and the real estate that it’s given, but zero click information and Google My Business, in my mind, has more of a future because the big change in healthcare would be if you can make an appointment to get into your doctor or to an Urgent Care clinic directly from Google, [without ever] having to click over to Banner Health or any other health system, that would be a zero click conversion.

Google is working towards that in many industries, including healthcare. And it’s probably not going to be a 2021 solution that you see, but it’s not too far down the road. And being able to provide our consumers with as much information, and as much access as they can out of local search is an extremely strategic focal point for us at Banner Health, and one that we’re keeping a close eye on.

So, we’re very active within our local search tools, [and] with our listings. We want to make sure that we’re providing everything that we can, and the information in there is as up-to-date as possible. So, we solicit reviews. We post new information. We provide videos. We provide images. And that continual effort to work the local search has paid very good dividends for Banner Health.

Also read: 9 Metrics That Help Measure Customer Engagement

Being able to provide our consumers with as much information, and as much access as they can out of local search is an extremely strategic focal point for us.

JP: I think that’s a well-informed look at what may lie ahead. When it comes to that local search space, what other changes are on the horizon for you and your team in a post-pandemic world?

PK: That is yet to be known. Right now, we’re kind of letting the data tell us what to do. Our research team is constantly bringing us new information on the consumer perspective [within a] COVID and a post-COVID world. And, right now, we’re continuing our messaging of safety and a Safe Place For Care, but we realize that that may not last forever, and that we need to plan for the future.

I think what we want to do is make sure that, no matter where you are on the spectrum of COVID-concern, whether you feel very comfortable without a mask and you’d like to go about your life like it’s 2019, great! Or if you are forever changed, and you need to know that there are certain safety protocols for you wherever you go, great, we also want to make that person feel very comfortable.

So, planning for those two different consumer types is something that is existing at Banner Health, as well as understanding the nature of the changing landscape of healthcare with the digital space, and how those two things can work together to be each other’s benefit.

JP: Such an interesting road ahead, no doubt, regardless of how that crystal ball changes over time. But you’ve been very generous with your time today, Patrick, thank you again for joining us, and for the great conversation.

PK: Oh, thank you so much, Jessica. I enjoyed it.

If you’d like to learn more about Banner Health, you can visit BannerHealth.com or follow them on Facebook, Twitter, and YouTube, all at Banner Health.

If you’re interested in learning more about Tallwave and how we help companies design exceptional customer experiences, contact us today. You can also read and download our recent research report, “Data-Driven Insights Into the Evolving Customer Experience” here.

Categories
Customer Engagement Uncategorized

9 Metrics That Help Measure Customer Engagement

Gaining new customers is only half the battle when it comes to sustaining a healthy business — keeping customers engaged and loyal to your company long-term is just as important. Sometimes, that’s easier said than done, especially considering the changing nature of customer preferences.


Most companies are challenged with constantly iterating their customer engagement strategies. Oftentimes larger enterprise companies bear more of that brunt in order to maintain market share as more agile upstarts join the scene.


Also read: Data Driven Insights Into the Evolving Customer Experience 


Case and point: A large entertainment and communications firm – despite having experience that predates the internet – came to us with plummeting retention rates. Identifying the cause of their customer churn was essential to strategizing and implementing an improved experience for the future. By conducting research to understand the end-to-end customer journey, we were able to uncover and map out internal and external stakeholder perspectives at each stage. Using that information, we identified which stages in the journey had the greatest impact on customer loyalty. Then we were able to create a prioritized list of suggested improvements to enhance the customer experience and drive a greater bond between the business and their audience.


It’s this kind of work that can make the world of difference when it comes to increasing customer engagement.


Reducing friction and inspiring trust are the cornerstones of customer engagement today. A recent Salesforce study found that 95% of consumers said trust makes them more likely to remain loyal while 80% said the customer experience is just as important as the product or service.


Reviewing the journeys your customers take helps to identify ways to increase convenience and drive engagement, which is essential for success. Here are some top methods to measure customer engagement.

Reducing friction and inspiring trust are the cornerstones of customer engagement today.

Top Customer Engagement Metrics

There are a variety of metrics you can use to create a full picture of your customer experience and increase customer engagement. Here are some of the most frequently used methods::

1. Net Promoter Score (NPS)

NPS is the leading metric for measuring customer satisfaction and loyalty. This is accomplished by asking customers one, simple question to rate the likelihood that they would recommend a company, product or service to a friend or colleague. The rating is on a scale of 0 -10, with zero being “not at all likely” and 10 being “extremely likely.”


How to calculate: Respondents are divided into three groups based on their score.


  • Promoters: (rated 9-10) are loyal customers who will also refer others to your company.
  • Passives: (rated 7-8) are satisfied, but not enthusiastic.
  • Detractors: (rated 0-6) are unhappy customers and could potentially damage your brand by spreading negative reviews.

To calculate your NPS score, subtract the percent of Detractors from the percent of Promoters. Here’s what the formula looks like: % Promoters – % Detractors = NPS. Your NPS can range anywhere from -100 to 100 depending on your ratio of promoters to detractors.

% Promoters - % Detractors = NPS

How it infers customer engagement: Your NPS score is a good measure of your customers’ overall perception of your brand. Customers who fit the Detractor category are unhappy, these are the customers most likely to speak poorly about your brand to others or leave negative reviews. Customers who fit the profile of Passives are not excited about your business and are unlikely to be loyal if a competitor comes along with a sweeter offer. Customers who are considered Promoters are not only loyal, but will act as ambassadors for your company. It’s best to compare your NPS to others in your industry and also to your past scores to monitor any changes in your customers’ perceptions.


Also read: The What, Why, & How Of Customer Behavior Analysis


Best for: This classic customer engagement tool is best for gaining a high-level understanding of customer experience and how loyal your customers are.

2. Customer Satisfaction (CSAT)

CSAT is short for Customer Satisfaction Score. It is a popular metric to gauge customer satisfaction levels for a specific product/service or action you took rather than an ongoing customer relationship.. A CSAT score is expressed as a percentage (100% to 0%). Using the results from a customer surveys that ask respondents to “Rate their overall satisfaction with the goods/services they received. Respondents use the following 1-5 scale:


1 = Very Dissatisfied (or Very Bad)

2 = Somewhat dissatisfied (Poor)

3 = Neither satisfied nor dissatisfied (Neutral)

4 = Somewhat satisfied (Good)

5 = Very Satisfied (Excellent)


How to calculate: To understand your CSAT, you’ll want to divide the number of satisfied customers (represented by those who responded with a 4 or 5 ) by the total number of customers.


Use this formula to calculate: Number of satisfied customers (4 and 5) / Number of survey responses) x 100 = % of satisfied customers

Number of satisfied customers (4 and 5) / Number of survey responses) x 100 = % of satisfied customers

How it infers customer engagement: Your CSAT score is helpful to measure customer satisfaction after an experience or touchpoint with your business. It’s not typically used to represent customer engagement over time, since it’s a snapshot of how each individual customer was feeling during the exact circumstances of the survey.


Best for: CSATs are typically easier to collect than other data points because you’re not asking a lot of your customers. CSATs are also easily understood across many channels of your organization. This makes them ideal for creating company-wide benchmarks that you can update consistently.

3. Customer Lifetime Value

Your customer lifetime value indicates how much your company can expect to earn across an entire relationship with a customer from start to finish. Segmenting your customers by lifetime value can help your company get strategic about the most important groups to engage for long term revenue growth.


How to calculate: Before you can calculate the customer lifetime value, you need to know the average customer value. You do this by determining the average purchase value and then multiplying that by the average number of purchases. That first formula looks like this: Average Purchase X Average Number of Purchase = Customer Value.

Average Purchase X Average Number of Purchase = Customer Value

Then, put that number into the following formula: Customer Lifetime Value = Customer Value X Average Customer Lifespan.

Customer Value X Average Customer Lifespan = Lifetime Value

How it infers customer engagement: It goes without saying that the happier your customers are with your product or service, the more likely they are to continue purchasing renewals or upgrades. Focusing on improving your customer lifetime value typically means you’ll surround customers with support and incentives, which can also lead to higher customer engagement scores. Best for: Compare your customer lifetime value to the cost of acquiring new customers so you can understand if your value realization is strong enough to offset the marketing or sales costs associated with generating demand.

4. User Activity

User activity measures how many unique customers are interacting with your product or service in a specific time frame — typically daily or monthly. This is an ideal customer engagement metric for SaaS companies or apps.


How to calculate: Calculating daily user activity hinges on accurately defining what you’ll consider a user and an activity. To get a strong sense of how users are interacting on your platform, you might want to count actions such as pulling reports or collaborating with team members instead of merely sign ons or app opens.


How it infers customer engagement: By measuring activities that would only happen if the user was engaged — like creating reports, for example — you can begin to understand how often your users are incorporating your features into their lives. If you notice some features are under-utilized, this could be a warning sign that your customers aren’t fully engaging with the potential of your offerings.


Best for: This metric is best for understanding what features of your product are most engaging for customers, so you can continue to iterate on these and improve your value realization opportunities.


Also read: How to Holistically Map the Customer Experience

5. Visit Frequency

Measuring the visit frequency shows you how often the same customer returns to your site or store location. This helps you to understand how familiar your customers are with your brand and the extent to which they are actively seeking your company.


How to calculate: Using Google Analytics, you can pull a count-of-session report to understand visit frequency to your website. Measuring visit frequency for brick-and-mortar locations has historically been more difficult, but new technology, such as Ripple Metrics, can actually measure return frequency in addition to other actions your customers take in store.


How it infers customer engagement: If you have many of the same customers returning over time, this shows a higher level of engagement. However, if you have customers visiting your site or location once and not returning, this shows you have more work to do in order to foster customer loyalty.


Best for: Visit frequency can be seasonal. For example, if you work at an oil change garage, you might only expect customers to return once every six months. That’s why measuring visit frequency is a good metric for companies that understand what the patterns of a happy customer look like. Gain clarity on the big picture of your customer journey so your visit frequency inferences will be valuable.


6. Screentime

Measuring how long a customer spends on your site can tell you how valuable your content is and the extent to which you are helping to make the lives of your customers easier. If your customers spend a long time reading an article or watching a video, congratulations, that means you gave them something to stick around for.


How to calculate: Using your website analysis tools, you can pull a report to specify the total time on site or get specific to understand how long customers are spending on each page.


How it infers customer engagement: If you notice customers are routinely spending a few seconds on each page, that could be a sign that your website content is not engaging. Typically the first action users take when they realize a webpage doesn’t have the information they need is to close it and move on to the next one. This metric can help you determine what content is hitting home with your customers and what needs more work.


Best for: This metric is essential if you rely on content marketing to drive sales or improve the customer experience.

Understanding your customer engagement isn’t always a matter of gathering the most information, but of understanding which metrics to focus on.

7. Pages per Session

Pages per session shows you the average number of pages a visitor to your website reads before they leave your website. Similar to screentime, this metric can show you the extent to which visitors are enjoying your website and gaining value from it.


How to calculate: You can determine the pages per session by dividing the total page views by the total amount of sessions for any given time period. If you use Google Analytics, this number should automatically be pulled for you through the program’s standard reporting in the acquisition overview section. To get more detailed, remember to segment by source. You might find that visitors coming from one channel are more heavily engaged, which could influence how you spend advertising dollars.


How it infers customer engagement: If you have a high number of pages per session it’s likely visitors to your site are finding a lot of useful information and that you are providing a quality user experience. If you find this metric drops over time, it could signal that you need to revisit your content or maintain your website.


Best for: Use this metric to understand how well your website is performing when it comes to serving your customers.


8. Churn Rate

Your churn rate measures the number of customers who are concluding their relationship with your business over a set period of time. For example, if you are a service with subscribers your monthly churn rate would show the percentage of users who have cancelled their subscription each month.


How to calculate: Calculating your churn rate is simple, just divide the number of customers who have stopped doing business with you by the total number of customers. For example, if you have 20,000 subscribers and 1,000 cancelled last month, you would have a churn rate of 5% for the month.


How it infers customer engagement: If you have a high churn rate you can infer that somewhere along the line your customers are becoming disappointed. You’ll need to do some work to understand where in the journey they are seeing less value so you can improve these pain points and extend the customer lifespan.


Best for: This is a good metric for softwares or subscription services that rely on monthly recurring revenue.

9. Social Media Engagement

Your social media engagement can show you how interested your customers are in hearing from you and sharing about the work you do. A high social media engagement rate doesn’t always equate to increased sales, but it can definitely help guide your team to know if you’re on the right track in developing rapport, loyalty and strong word-of-mouth.


How to calculate: To get a high-level view of your social media engagement, measure your average engagement rate by adding the total number of engagements on a given post (this includes likes, comments and shares) by your total number of followers.


How it infers customer engagement: If your social media engagement numbers are low, this could be a sign that you need to do more work providing daily value to your current customers to turn them into brand evangelists. Not all companies rely on social media though, so if your social engagement numbers are low but you have another channel that does well, such as a newsletter, you might want to weigh both sets of metrics against each other before taking action.


Best for: Social media engagement can help companies understand how well they are doing when it comes to creating brand awareness and enthusiasm.

Bottom Line

Understanding your customer engagement isn’t always a matter of gathering the most information, but of understanding which metrics to focus on. Every brand should choose a handful of metrics that matter most to their business operations. Depending on your goals, there are only a few metrics that should be tracked regularly to gauge engagement, loyalty, value realization and growth. For the client we mentioned at the start of this article, we were trying to solve for high customer churn. We decided to narrow available data down so we were only focusing on mapping customer satisfaction. We felt this metric could most accurately predict churn. By understanding where in the journey customers were least satisfied, we were able to identify where drop off occurred.

Curious how the evolving customer experience is changing customer sentiment? Check out our recent research report, or contact us today.

Play Video

Bunger Steel

Doing some things and making some impacts