Categories
Customer Engagement Reaching New Customers Strategy

Mastering full-funnel marketing for lasting growth

Many companies have shifted their focus to bottom-of-funnel tactics, like paid search and retargeting ads, as economic uncertainty drives budget constraints and increases the pressure to make sales. However, this imbalanced approach will almost certainly have a lagging negative impact on revenue and ROI.

Implementing a full-funnel marketing strategy can fix the imbalance and ensure long-term growth and sustainability. Let’s look at the full marketing funnel, why stage-specific engagement matters, and how to bring them to life.

What are the stages of full-funnel marketing?

Marketing strategy is often compared to a funnel because of the shape it takes as consumers move through the purchase journey. 

A chart showing the conversion funnel.

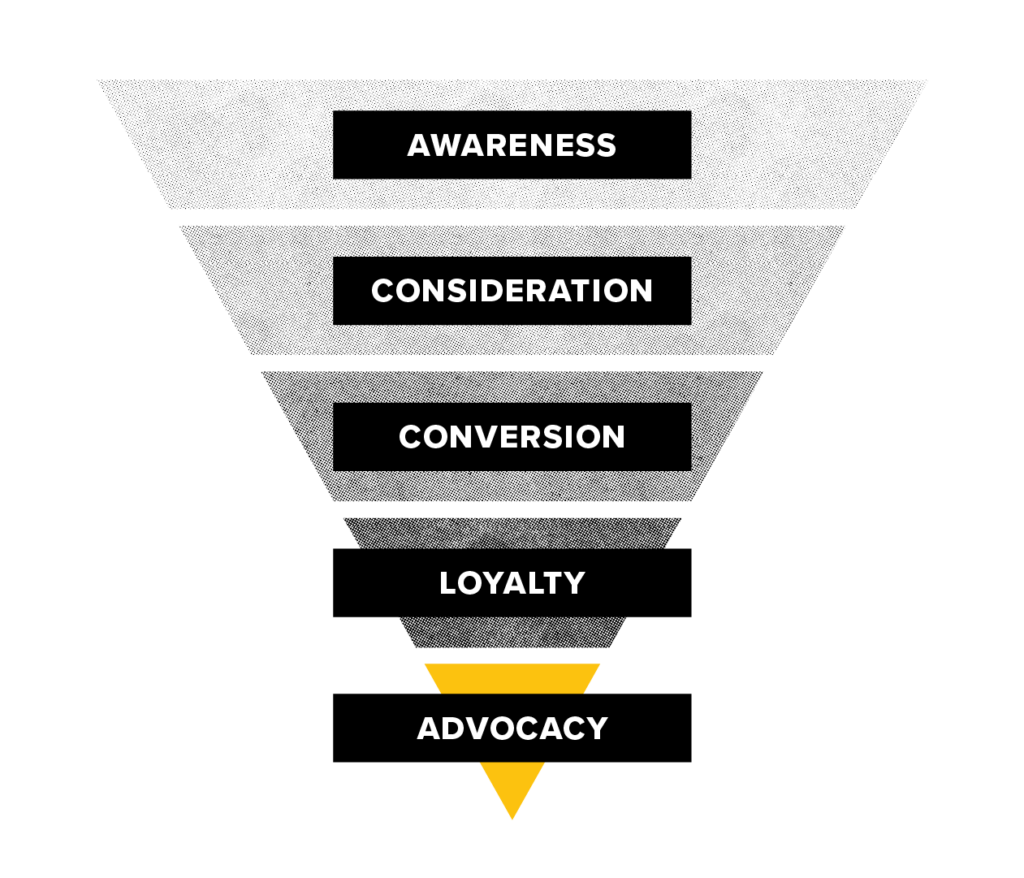
Stage 1: Top-of-funnel

Awareness tactics (at the top of the funnel) are broad and cast a wide net to reach consumers. This might include things like radio ads, billboard ads, blogs, or public relations campaigns. 

The purpose of top-of-funnel tactics is to get your brand in front of your audience and generate brand awareness. As such, success for these individual tactics should be measured by publisher metrics like impressions, reach, frequency, and video completion rates or through survey metrics like lift in brand awareness and ad recall. A common misstep we see marketers make is trying to measure the success of a top-of-funnel tactic by the number of conversions it drives. Billboards aren’t going to result in a click-through conversion, but they do influence consumers who may not even know they want to buy your product or service yet. Similarly, an attribution model that ignores the role top-of-funnel tactics play as part of the confluence of factors that ultimately drive conversion can work against you.

Stage 2: Mid-funnel

Consideration tactics (in the middle of the funnel) focus on consumers who are familiar with and evaluating the brand. Tactics deployed at this might include product-specific emails, FAQ pages, and organic search strategy. 

This is the stage where we start to see consumers interacting with the brand so success metrics look different than those in the top of the funnel. Here, we are interested in engagement metrics like click-through rates, social media interactions, rich media interactions, average time on site, pages visited per website engagement, scroll depth, and non-conversion website events (e.g., PDF downloads, webinar registrations, video completions, etc.).

Stage 3: Bottom of the funnel

Conversion tactics (at the bottom of the funnel) get in front of consumers who are ready to make a purchase. Paid search is a major tactic at this stage of the funnel, but tactics might also include website content like comparison charts or savings calculators.

This is the stage at which we measure tactical success in terms of conversions. Consumers, influenced by the awareness and consideration driven higher up in the funnel from other tactics, are now ready to make a purchase or submit a lead form.

But it doesn’t end there! After consumers convert, they move into the loyalty part of the funnel. The tactics in this part of the funnel keep consumers coming back. It might include things like personalized content, rewards and loyalty programs, or incentive campaigns.

The success of your loyalty program can be measured by customer retention rate, customer lifetime value, and repeat purchases.

The lowest part of the funnel is advocacy, which is all about getting consumers to tell their friends about your brand. This often takes the form of customer reviews and referral programs and can be measured by metrics like customer satisfaction scores, online reviews and sentiment analysis, and social listening insights.

Why does a full-funnel marketing strategy matter?

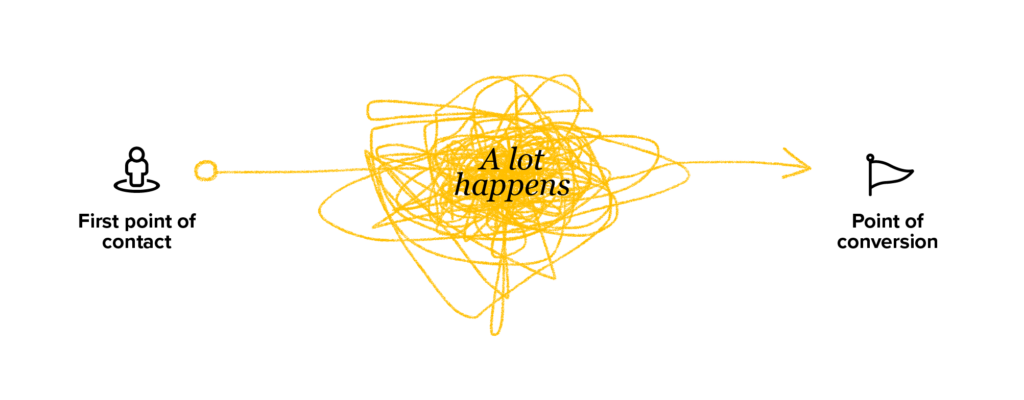
Although marketers like to position their strategy into a nice, neat little funnel, the reality is that the consumer journey is not so nice and neat. It’s also not linear. On average, it takes 8-12 touchpoints with a brand to convert a customer! 

An image depicting the unclear path that often occurs between the first point of contact and conversion.

The beauty of a full-funnel marketing strategy is that it helps you meet consumers where they are in their journeys. It is a holistic, integrated approach that drives repeat exposure and facilitates multiple touch points with customers at different stages of their journey, which is critical for ensuring your brand is top of mind when the moment of truth comes and a buying decision is made.

The negative impact of a bottom-of-funnel approach

Conversion-focused tactics often get the most attention because they produce the most conversions. But consumers can’t convert if they aren’t aware of your brand. Consumers won’t convert if they know about your brand, but haven’t taken the time to consider what it means to them. By neglecting the upper parts of the funnel, you choke the funnel and restrict your ability to drive conversions in the long term.

Unfortunately, many companies get overly focused on the bottom-of-funnel tactics due to the very real and understandable pressure that marketers get from leaders focused only on transactional KPIs. This is especially true in times of economic uncertainty (check out our white paper on how to optimize your customer experience for recession resilience) when driving revenue takes on a heightened priority.

A broken funnel can manifest in many ways:

Poor engagement rates

If you skipped over the awareness part of the funnel, consumers may not be familiar with your brand. Trust and credibility have yet to be established and so they are not prepared to engage with your content.

High engagement, but low conversion

Similarly, if consumers are clicking, but not converting, may not be meeting them at the right point in their journey.

Conversion stagnation

Often a symptom of low-funnel strategies, you may have tapped out your available audience by ignoring critical awareness tactics.

Unintentionally over-indexing on first-time customers

It is 5-7 times more expensive to acquire new customers than to retain existing ones. If your customer base is over-indexed on new customers, you may need to double down on your retention efforts.

Decrease in branded searches

Customers can’t search for you if they don’t know about your brand. Investing in top-of-funnel tactics is crucial to driving brand awareness.

Increase in costs to convert

Persistent increases in cost per lead (CPL) or cost per acquisition (CPA) signal that you are competing for a finite, over-indexed audience and would benefit from upper-funnel tactics.

Bringing a full-funnel marketing strategy to life

If any of the scenarios above sound familiar, it’s probably time to evolve your marketing strategy to adopt a full-funnel approach.

Here are some key considerations when establishing a full-funnel marketing strategy: 

Teamwork makes the dream work

A full-funnel marketing strategy requires collaboration across multiple teams (think strategy, brand, paid media, creative, content, design, PR, email, loyalty… the list goes on!) to ensure thoughtful, cohesive customer experiences. Make sure you are pulling in representatives from all the appropriate teams to drive alignment and ensure consistency.

Measurement matters

An appropriate measurement strategy is key to keeping a full-funnel strategy on the rails. As we described when defining the stages of the funnel, KPIs must reflect where tactics sit within the funnel to properly measure success and make informed marketing decisions.

Similarly, an attribution model can make or break your strategy. Last-click attribution models in particular can influence over-indexing on bottom-of-funnel tactics by assigning credit to the last touch before a conversion. This model puts a thumb on the scale for bottom-of-funnel tactics, limiting the ability to optimize for the distinct goals of tactics that play other roles in the funnel. Linear or data-driven models are generally more effective at assigning appropriate value to tactics throughout the funnel. 

Be patient

The impact of a full-funnel strategy won’t be felt immediately. Upper-funnel efforts build future demand. Building loyalty and driving advocacy takes time. But this strategy sustains growth marketing investment in the long term by allowing you to reach more potential customers, extending the lifetime value of those customers, and generating more profit for less investment by driving efficiencies across the program.

The bottom line: full-funnel marketing strategies work

A recent Nielsen study of CPG brands showed that those with a full-funnel strategy had 45% higher ROI and a 7% increase in offline sales compared to marketing campaigns running in a single purchase stage.

We recently published a case study about how we helped a nonprofit client of ours drive efficiencies in their paid media program by enhancing their bottom-of-funnel paid media program to a full-funnel one. In the first year of running this full-funnel program, our client spent 9% more on paid media year over year, but produced 61% more donations.

Designing holistic customer experiences that drive growth is our strength. Because full-funnel marketing strategy is a team sport that requires participation from multiple teams, internal silos are the enemy of creating a holistic, integrated strategy. At Tallwave, we pride ourselves on two things: 1) relentlessly keeping the customer at the center of what we do at every stage of the journey and 2) driving integration and collaboration in the strategies that drive the customer experience so we can deliver successfully against your customers’ needs and your business goals. 

Ready to learn more about how Tallwave can help enhance your marketing program? Give us a shout!

Categories
Customer Engagement

9 Quantitative Research Methods With Real Client Examples

Quantitative research is essential to developing a clear understanding of consumer engagement and how to increase satisfaction.

Primary Quantitative Research Methods

When it comes to quantitative research, many people often confuse this type of research with the methodology. The research type refers to style of research while the data collection method can be different.

Research types

These are the primary types of quantitative research used by businesses today.

  • Survey research: Ideally when conducting survey research businesses will use a statistically relevant sample to understand the sentiments and actions of a large group of people. This could be their current customers or consumers who fit into their ideal demographic.
  • Correlational research: Correlational research compares two variables to come to a conclusion about whether there is a relationship between the two. Keep in mind that correlation does not always imply causation, which is to say you need to account for external variables that could cause an apparent relationship.
  • Experimental research: This form of research takes a scientific approach, testing a hypothesis by manipulating certain variables to understand what changes this could cause. In these experiments, there is a control group and a manipulated group.

Also read: 6 Factors Influencing Customer Behaviors in 2021

Data collection methods

Launching the above research requires creating a plan to collect data. After all, quantitative research relies on data. Here are the common primary data collection methods for quantitative research.


  • Surveys: A common approach to collecting data is using a survey. This is ideal especially if the business can obtain a statistically relevant sample from their responses. Surveys are often conducted through web or email questionnaires.
  • Interviews: Yes, interviews can be used to obtain quantitative data. While this form of data collection is typically associated with qualitative research, interviewers can ask a standard set of questions to collate formal, quantitative data.
  • Documentation review: With an increasing amount of business occurring digitally, there is more documentation now than ever before to help inform quantitative conclusions. Businesses can assess website metrics such as return visits, time on page or even use a pixel to track customer movement across websites. They can also view how many times their app has been opened and actions users have taken on their platform to determine customer engagement.

Secondary research can be helpful when formulating a plan for obtaining primary quantitative data. It can help narrow areas of focus or illuminate key challenges.

Secondary Quantitative Research Methods

Secondary data is information that is already collected and not necessarily exclusive to the company but still relevant when understanding overall industry and marketplace trends. Here are a few examples of secondary data:

  • Government reports: Government research can indicate potential regulatory roadblocks, customer pain points and future opportunities. For example, a fitness company might use government data that shows an increase in use of outdoor running trials to develop a new product used to meet that specific use case.
  • Survey-based secondary data: Polls or surveys that have been conducted for a primary use could be reused for secondary purposes. This could include survey data obtained by other companies or governments.
  • Academic research: Research that has been previously conducted and published in peer-reviewed journals can help inform trends and consumer behavior, even if it doesn’t apply to a company’s specific customers.

Secondary research can be helpful when formulating a plan for obtaining primary quantitative data. It can help narrow areas of focus or illuminate key challenges. It can also help when it comes to interpreting primary data, especially when trying to understand the relationship between two variables of correlated data.

Also read: The What, Why, & How of Customer Behavior Analysis

Real Examples of Quantitative Research

We regularly use quantitative research to help our clients understand where they can best add value to increase customer engagement. Here are three examples of quantitative research in motion.

Example 1: Leading food distribution company

We helped a leading food distribution company identify changes in the needs and values of their restaurant clients as a result of COVID-19. This helped inform opportunities to become more valuable partners.


The research plan involved creating a survey that was emailed to clients. The questions were specific and numeric. For example, respondents were asked what percentage of their weekly spend was used with the food distribution company. They were also asked to assign a percentage to the way their food ordering had changed during COVID-19 and to rate their satisfaction with the food distribution company.


The results showed changes that had occurred for clients of the food distribution company as a result of the unique stressors of the pandemic. We were able to determine changes in weekly food supply and customer count as well as menu adaptations and purchase behavior.


Example 2: Leading credit card company

Our work with a leading credit card company required us to understand what current travel card members valued about the rewards program and their preferred communication method for booking travel in order to create an omnichannel servicing strategy and ideal customer journey.


Through an online survey of younger cardholders, the target demographic for this project, we asked questions such as length of card membership, total spend and the number of annual leisure trips in addition to more specific questions that showed how members get inspiration for trip planning and where they research.


The results highlighted ways to overcome resistance to pricing by proving more value. It also illuminated ways to make the benefits of membership more tangible to card holders and how to influence travelers in the early stages of planning their journey.

Example 3: Internal research report

We’re in the business of drinking our own champagne, so to speak, which is why we conducted our own quantitative research aimed at understanding the consumer trends that were spurred by the pandemic and how these will transform behaviors in the future.


There’s no question that new customer experiences emerged from the pandemic. Think of offerings such as “buy online, pickup in store (BOPIS),” or blended restaurant meals that are cooked at home. We wanted to understand how consumers truly felt about these new experiences and which they were likely to continue using even after restrictions were lifted. We also wanted to know more about the changing expectations for branded communication and how all of these pieces of the puzzle fit together to create consumer engagement. Our method of data collection was a survey.


Our research led us to develop insights we could use to inform our customers in their decision making. For example, we found convenience is paramount for consumers who are seeking out hybrid experiences such as BOPIS to take the best of both worlds. We also found many of these changes are permanent as consumers embraced new experiences that made their lives easier.

We regularly use quantitative research to help our clients understand where they can best add value to increase customer engagement.

The Bottom Line

Quantitative research is essential to developing a clear understanding of consumer engagement and how to increase satisfaction. Though online surveys are one of the most common methods for obtaining data, research isn’t limited to this strategy. It’s important to use whatever strategies are within your scope to constantly evaluate new trends and consumer behaviors that could significantly impact your offerings. The results can show you how to re-engage customers and drive loyalty.


Interested in partnering with us to learn more about your customers needs, wants, and behaviors to inform future experience design? Contact us today!

Categories
Strategy

Qualitative vs. Quantitative Data In CX Design: Everything You Need to Know

This is a common issue for many organizations, big and small, but it’s not an impossible one to solve!


If you’re experiencing a similar situation, you need to invest in gathering persona data that will not only tell you who your customers are and what they care about, but why they care and how they expect brands to make them feel.


To get started, let’s define each set of data, how it’s gathered and what it’s used for.


What is qualitative data?

Qualitative data – or primary data – is commonly gathered by businesses and plays an important role in understanding target audience sentiment and informing customer journey design. By conducting unstructured or semi-structured first-person user interviews, discussions, on-site observations, in-house moderated user testing, web analytics, and focus groups, qualitative data-collecting techniques allow companies to interact directly with their key customers, see how they’re using their products or services and receive feedback in real-time. It helps define the customer journey and establish an initial foundation and understanding of all internal and external customer experiences.


There’s just one problem: Sometimes people don’t know what they want, don’t have the words to truly express how they feel, or simply, aren’t honest.


That’s when quantitative data comes in.

Quantitative data enhances primary research and design efforts by quantifying key problem areas.

What is quantitative data?

Quantitative data – which can be gathered through a variety of structured surveys, questionnaires, and polls – is essential secondary research. When transformed into statistics, it enhances primary research (qualitative data) and design efforts by quantifying key problem areas. It also allows marketers, developers, business leaders and customer experience drivers to peer into customer details, attitudes, and behaviors from a data-driven standpoint, and test hypotheses established from qualitative data.

Qualitative Data vs. Quantitative Data: When Should You Use Each & How?

Let’s start with the when. To craft the best customer experiences, companies should collect and analyze both data sources on an ongoing basis. Because – and this is a big one – audiences and their expectations are always changing. By executing primary and secondary research to gather qualitative and quantitative data, companies make themselves better equipped to not only identify, but truly understand their customer base – how they interact, experience, and feel about a website, application or overall brand.


And don’t forget to gather employee input, as well! Employees are often the first to know what’s working and what’s not. Most organizations shy away from gathering input from employees, but in our experience, leveraging this powerful knowledge base sooner rather than later helps identify root challenges and opportunities to improve faster and more effectively.


Also read: Crafting Employee Experiences That Improve Customer Experiences


Now, the how. After both qualitative and quantitative data has been collected, follow these steps:

Map your qualitative data

Example of mapping internal & external qualitative data

Using the qualitative data gathered, map internal perspectives around critical touch points and test it against customer feedback that was collected. This should reveal discrepancies between what internal teams believe is important, versus what customers assign value to. By taking this qualitative approach, teams can visually display opportunities and challenges within the current experience. Providing a picture that illuminates the differences between internal and external stakeholder perception makes achieving cross-functional alignment on future plans easier. There’s not a whole lot to argue about when the writing’s on the wall.

Pinpoint exact moments of friction and/or leverage in your customer journey

Utilize quantitative methods via surveys and other previously mentioned techniques to analyze customer sentiment – opinions and responses – as well as perspective at every stage of the journey. Keep in mind, each interaction a consumer can have with your brand, both passive and active, is a touchpoint and part of your overall brand journey. Therefore, every interaction must be diligently and continuously monitored, evaluated and iterated because one singular touchpoint can cultivate customer affinity or aversion.

Pair quantitative customer sentiment with a qualitative understanding of the user journey

Pairing qualitative and qualitative data

Quantifying the customer journey creates a data-driven understanding of the critical inflection points that drive loyalty and churn. This naturally illuminates root causes of friction (or conversion!) and enable teams to be data-driven in problem solving and planning for future CX initiatives and investments.

How To Use Qualitative & Quantitative Data To Decide on Next Steps

At Tallwave, we create an ‘Impact Matrix’ – this tool highlights opportunities for improvement and compares the impact they’ll each have against the level of effort and investment they’ll require. This helps create alignment and buy-in for low-risk, high impact initiatives that are critical to shaping and improving the customer experience.


Find a similar exercise or tool to visually demonstrate all the opportunities that lie ahead and inform the build of a new strategic roadmap that can take your teams and company into the future.


Perhaps most importantly, don’t let perfection get in the way of progress! Making big system changes to your end-to-end user experience may take time, but avoid trying to solve it all at once. Identifying the biggest opportunities and making incremental improvements over time, while learning along the way, will make a huge difference.


Last but not least, don’t stop. This isn’t a “set it and forget it” game. Customer behavior – be it with an existing website, application or with a brand across numerous touchpoints – must be closely monitored to ensure both user and business goals are consistently met. If they’re not, all teams – Content Strategy, Product Development, People & Culture, Performance Marketing – must align to identify solutions for evolution and continue growth.


Also read: Why Customer Experience Can’t Be All Data-Driven

Don’t let perfection get in the way of progress! Identifying the biggest opportunities and making incremental improvements over time, while learning along the way, will make a huge difference.

Bottom Line

Let data be your guide. Qualitative input is key, especially early on, but also leverage quantitative data as much as possible to make decisions. The combination of qualitative and quantitative helps you identify where there is friction, but also gives you the context you need to develop solutions that hit the mark. And if you don’t have the right data infrastructure set up today, that’s a good place to start.

If you need help collecting, comparing and mapping your qualitative and quantitative data to improve your customer journey and overall experience, contact our team today!

Play Video

Bunger Steel

Doing some things and making some impacts