Categories
Customer Engagement

9 Quantitative Research Methods With Real Client Examples

Quantitative research is essential to developing a clear understanding of consumer engagement and how to increase satisfaction.

Primary Quantitative Research Methods

When it comes to quantitative research, many people often confuse this type of research with the methodology. The research type refers to style of research while the data collection method can be different.

Research types

These are the primary types of quantitative research used by businesses today.

  • Survey research: Ideally when conducting survey research businesses will use a statistically relevant sample to understand the sentiments and actions of a large group of people. This could be their current customers or consumers who fit into their ideal demographic.
  • Correlational research: Correlational research compares two variables to come to a conclusion about whether there is a relationship between the two. Keep in mind that correlation does not always imply causation, which is to say you need to account for external variables that could cause an apparent relationship.
  • Experimental research: This form of research takes a scientific approach, testing a hypothesis by manipulating certain variables to understand what changes this could cause. In these experiments, there is a control group and a manipulated group.

Also read: 6 Factors Influencing Customer Behaviors in 2021

Data collection methods

Launching the above research requires creating a plan to collect data. After all, quantitative research relies on data. Here are the common primary data collection methods for quantitative research.


  • Surveys: A common approach to collecting data is using a survey. This is ideal especially if the business can obtain a statistically relevant sample from their responses. Surveys are often conducted through web or email questionnaires.
  • Interviews: Yes, interviews can be used to obtain quantitative data. While this form of data collection is typically associated with qualitative research, interviewers can ask a standard set of questions to collate formal, quantitative data.
  • Documentation review: With an increasing amount of business occurring digitally, there is more documentation now than ever before to help inform quantitative conclusions. Businesses can assess website metrics such as return visits, time on page or even use a pixel to track customer movement across websites. They can also view how many times their app has been opened and actions users have taken on their platform to determine customer engagement.

Secondary research can be helpful when formulating a plan for obtaining primary quantitative data. It can help narrow areas of focus or illuminate key challenges.

Secondary Quantitative Research Methods

Secondary data is information that is already collected and not necessarily exclusive to the company but still relevant when understanding overall industry and marketplace trends. Here are a few examples of secondary data:

  • Government reports: Government research can indicate potential regulatory roadblocks, customer pain points and future opportunities. For example, a fitness company might use government data that shows an increase in use of outdoor running trials to develop a new product used to meet that specific use case.
  • Survey-based secondary data: Polls or surveys that have been conducted for a primary use could be reused for secondary purposes. This could include survey data obtained by other companies or governments.
  • Academic research: Research that has been previously conducted and published in peer-reviewed journals can help inform trends and consumer behavior, even if it doesn’t apply to a company’s specific customers.

Secondary research can be helpful when formulating a plan for obtaining primary quantitative data. It can help narrow areas of focus or illuminate key challenges. It can also help when it comes to interpreting primary data, especially when trying to understand the relationship between two variables of correlated data.

Also read: The What, Why, & How of Customer Behavior Analysis

Real Examples of Quantitative Research

We regularly use quantitative research to help our clients understand where they can best add value to increase customer engagement. Here are three examples of quantitative research in motion.

Example 1: Leading food distribution company

We helped a leading food distribution company identify changes in the needs and values of their restaurant clients as a result of COVID-19. This helped inform opportunities to become more valuable partners.


The research plan involved creating a survey that was emailed to clients. The questions were specific and numeric. For example, respondents were asked what percentage of their weekly spend was used with the food distribution company. They were also asked to assign a percentage to the way their food ordering had changed during COVID-19 and to rate their satisfaction with the food distribution company.


The results showed changes that had occurred for clients of the food distribution company as a result of the unique stressors of the pandemic. We were able to determine changes in weekly food supply and customer count as well as menu adaptations and purchase behavior.


Example 2: Leading credit card company

Our work with a leading credit card company required us to understand what current travel card members valued about the rewards program and their preferred communication method for booking travel in order to create an omnichannel servicing strategy and ideal customer journey.


Through an online survey of younger cardholders, the target demographic for this project, we asked questions such as length of card membership, total spend and the number of annual leisure trips in addition to more specific questions that showed how members get inspiration for trip planning and where they research.


The results highlighted ways to overcome resistance to pricing by proving more value. It also illuminated ways to make the benefits of membership more tangible to card holders and how to influence travelers in the early stages of planning their journey.

Example 3: Internal research report

We’re in the business of drinking our own champagne, so to speak, which is why we conducted our own quantitative research aimed at understanding the consumer trends that were spurred by the pandemic and how these will transform behaviors in the future.


There’s no question that new customer experiences emerged from the pandemic. Think of offerings such as “buy online, pickup in store (BOPIS),” or blended restaurant meals that are cooked at home. We wanted to understand how consumers truly felt about these new experiences and which they were likely to continue using even after restrictions were lifted. We also wanted to know more about the changing expectations for branded communication and how all of these pieces of the puzzle fit together to create consumer engagement. Our method of data collection was a survey.


Our research led us to develop insights we could use to inform our customers in their decision making. For example, we found convenience is paramount for consumers who are seeking out hybrid experiences such as BOPIS to take the best of both worlds. We also found many of these changes are permanent as consumers embraced new experiences that made their lives easier.

We regularly use quantitative research to help our clients understand where they can best add value to increase customer engagement.

The Bottom Line

Quantitative research is essential to developing a clear understanding of consumer engagement and how to increase satisfaction. Though online surveys are one of the most common methods for obtaining data, research isn’t limited to this strategy. It’s important to use whatever strategies are within your scope to constantly evaluate new trends and consumer behaviors that could significantly impact your offerings. The results can show you how to re-engage customers and drive loyalty.


Interested in partnering with us to learn more about your customers needs, wants, and behaviors to inform future experience design? Contact us today!

Categories
Strategy

How to Holistically Map Your Customer Experience

But what is a customer experience map?


It’s a visual timeline that illustrates and examines a customer’s entire experiences with a brand, identifying every behavior, interaction, and touchpoint across a variety of channels. Unlike a customer journey map – which only outlines touch points involved from exposure to sale (and sometimes post-sale) – customer experience (CX) maps dive deeper, evaluating omnichannel experiences and internal processes and workflows to illuminate who and what customers interact with, pain points that arise, and moments of truth that are ripe for innovation and improvement.

Overview of the Customer Experience:

  • Start with the customer perspective. Utilize a mix of qualitative and quantitative data (methods below) to map key touch points
  • Map the internal stakeholder journey, including people, processes, systems, via a service blueprint
  • Combine the maps to begin comparing and contrasting the data and employee expectations versus consumer feedback
  • Identify gaps and opportunities, assess impact of innovation and prioritize for the future

While collecting customer feedback through both qualitative and quantitative (also known as moderated and observational) techniques is key (think web analytics, customer surveys, customer marketing data, customer recordings and interviews, industry research, etc.), it’s also equally important to map your internal stakeholder’s (aka, employee’s) journey, detailing moments they believe to be most important in an end user’s experience (this is often referred to as service blueprinting).


Once both maps are completed, they can be compared and contrasted to uncover discrepancies in the customer and internal experience. Pinpointing moments of friction illuminates root causes of customer experience breakdowns that create incredible drag on company retention and growth. Only by taking this holistic approach can you truly start to cultivate next-level strategies for improved customer experiences.

How to Create a Customer Experience Map

As you venture into making your own customer experience map, here are some things to watch out for:


  1. Don’t get stuck in the surface. Make sure that you’re driving to the core and really trying to identify the root cause of experience friction points or issues.
  2. Ensure you take an interdisciplinary approach. It’s important not to be siloed in this thinking.
  3. Don’t just take qualitative notes. When interacting with customers, take a multi-faceted approach. You want to ultimately be able to map your qualitative data with quantitative data. Incomplete data can lead to poor decision-making.
  4. Don’t get too bogged down in the details. Come up for air and focus on the biggest areas of opportunities for improvement. It’s all about prioritization. Lots of companies try to solve or map everything, when in reality – sure, you need to challenge your data and ensure you have a complete view – but you also have to prioritize as you go. It’s a delicate balance to strike.


How to Map the Customer Journey | Tallwave

To get started, you must first acknowledge that every touch point is interconnected and feeds into a customer’s perspective and sentiment towards your brand as a whole. The exercise must be authentic. Your goal is to understand your brand’s latent needs and to uncover opportunities that exist due to changing market dynamics, customer expectations and technology breakthroughs.


Then, you must allocate one person or team to see the exercise through to completion. Typically speaking, customer experience mapping should be co-created with an external party. Research done solely in-house can be blanketed by unconscious bias, thus muddling results and growth opportunities. Plus, it’s important stakeholders surveyed throughout feel comfortable expressing their true and honest opinions in a confidential and removed setting.


Once that’s done, it’s time to get to work.

Step 1: Define your goals, scope, and personas

Your team must first align on goals. Conduct a half-day session with the key internal stakeholders across a number of teams to define business and user goals and pinpoint what you want to learn, what you’re hoping to uncover, where you want to drive focus, and how you plan to quantify and validate insights uncovered.


Then, define the personas you want to explore with during the experience mapping exercise. Many businesses have numerous consumer groups. While you can (and eventually should) map the experience and expectations of all of them, you’ll want to identify who they are first. Key details like age, marital status, occupation, daily activities, needs, wants, hobbies, internet behaviors, social media interactions, etc. are all a great starting place. Remember the 80/20 rule and prioritize which groups you’re going to start with. These are your primary personas.


Now that you have them identified, you’ll want to start the mapping exercise by capturing existing hypotheses about your customers and their experience. Be sure to capture their needs and emotions felt throughout all of their experiences with your brand. Some key questions to remember here:


  • What is driving their buying behavior? Why are they interacting with your business?
  • Where do they interact with your brand (before and after purchase)?
  • How many steps do they go through to purchase?
  • How do they feel as they decide to purchase? Is there a touchpoint after they purchase?
  • How do they interact with your brand after they’re a customer? etc.

Next, decide which part of your experience you want to map. In an ideal world, you’d map the entire experience over the tenure of a customer’s relationship with your brand, but that’s likely not doable in your first few sessions. To get started, break experience mapping into segments. Do you want to map the onboarding or registration process? The purchasing journey? Gauge the interactions your brand has with customers once they’ve already bought in? .


Also read: Understanding the Buyer’s Journey to Drive Targeted Campaigns

If you’re stuck – simply try to pinpoint where you think there is the most pain, friction, or confusion in your customer journey. Whether it’s the first, tenth or fiftieth exchange, one bad experience can greatly increase risk of customer churn. A customer who is dissatisfied with an experience will tell between 9-15 people about it* (and that number increases quickly if they take their negative review to social platforms!).

Step two: Evaluate from within

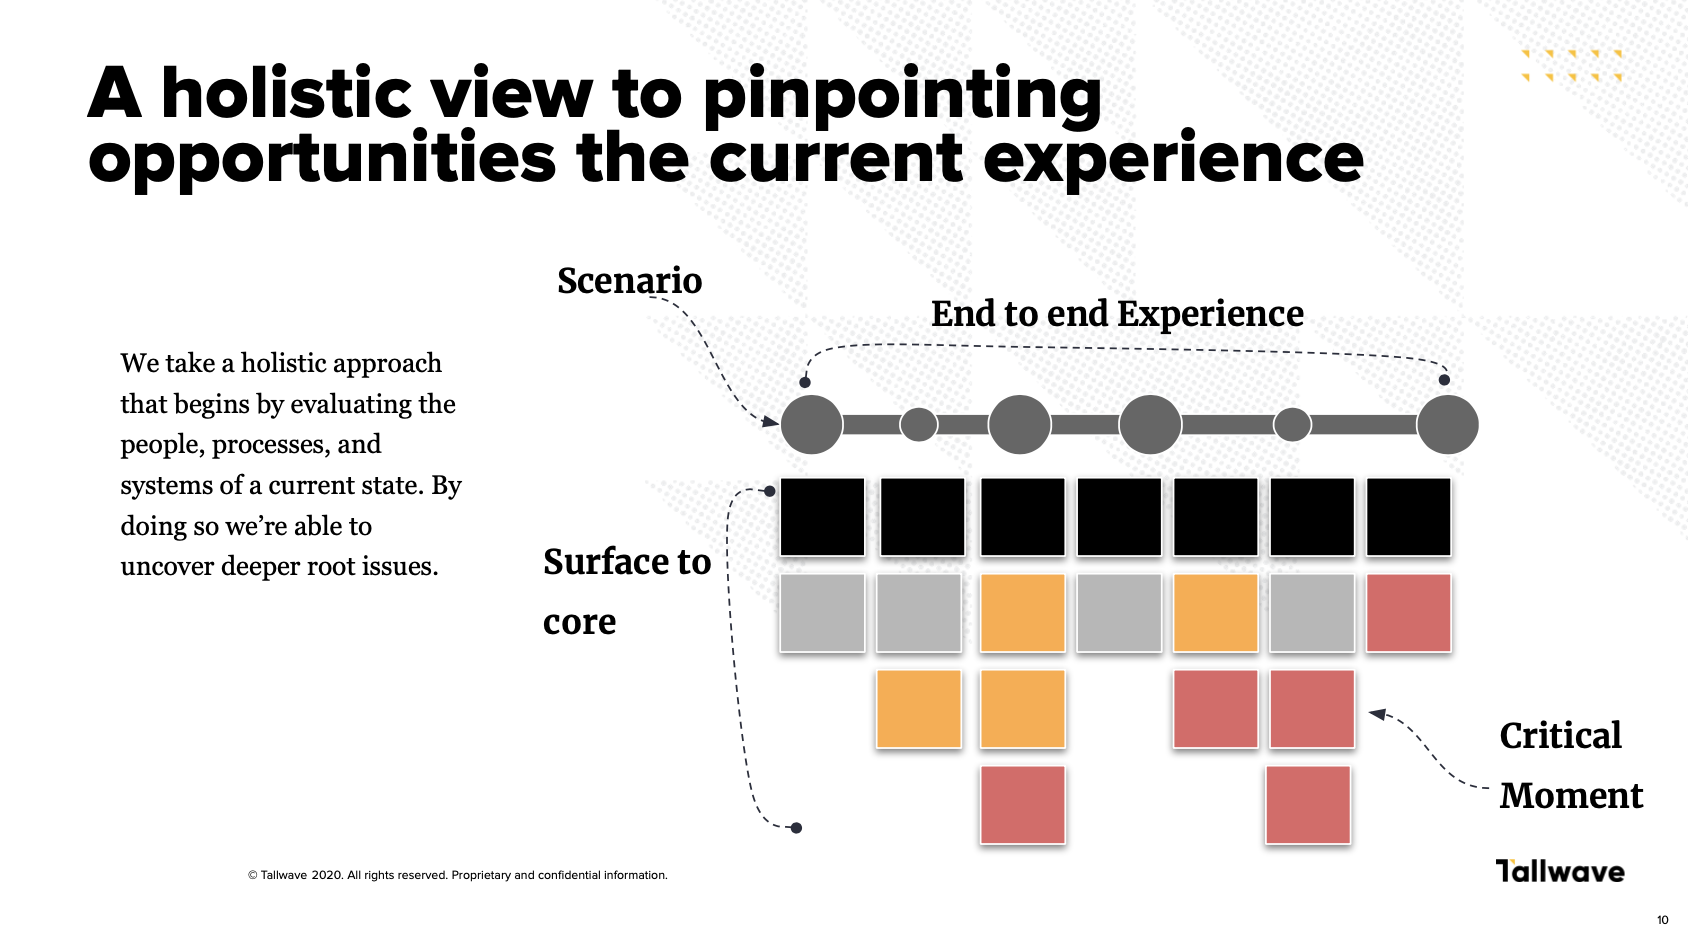
Holistically mapping out your current end-to-end customer experience requires that you evaluate every touchpoint from the surface to the core. That means, you must first evaluate your own people, processes, and systems that impact and touch the customer experience in any way (many organizations refer to this as service blueprinting).


Holistic view of customer journey experience | Tallwave

By doing this, you can uncover deep rooted issues or discrepancies between what internal stakeholders and external customers deem important. This is a critical step in effecting meaningful change to your customer experience. But be mindful to avoid these common pitfalls as you execute:


  • Getting bogged down in the internal perspective: Make sure all focus efforts are on pain point identification as it relates to the customer or your ability to deliver to the customer. This isn’t an exercise solely dedicated to internal frustrations – if you’re wanting to improve the employee experience, that’s a true service blueprinting exercise. For holistic customer experience mapping, you want to make sure your focus is on pain points that have a line of sight to your end users.
  • Settling for the surface answers: Push to go beyond and really discover the root cause or root opportunities present in your current experience.
  • Missing the opportunity to loop in interdisciplinary perspectives: Often, the connection between business units – especially ones that have overlapping activities related to the customer experience – is where you’ll uncover the greatest opportunities for improvement. Every company has handoffs. It’s important to consider them all.
  • Hinder real discussions from happening between stakeholders: Bringing people together can be massively beneficial. This is an opportunity to create alignment. By bringing teams together to work towards one common goal and share their individual team’s hurdles, your teams will naturally discover micro-solves that can be executed immediately, and contribute to the macro-solution.

Now, to get a revitalized understanding of your business’ performance and efficiency, conduct workshops with internal stakeholders – this can include customer service and sales reps, researchers, customer experience specialists, marketing leads, product owners, designs and more. These service blueprinting workshops should include a few important exercises:


  1. Hypothesize and map out internal interpretation of the customer’s journey. Be sure to identify each phase and define customer interaction points.
  2. Map out the people, process and systems that are in play at each of those key interaction points.
  3. Capture what internal stakeholders say about those key interactions (qualitative). Simple things like definitions of words, or what they want customers to feel after that interaction can all be important in understanding the internal impact on your CX.
  4. Articulate underlying assumptions and beliefs around language commonly used to describe KPIs and company-wide goals. This will help identify and deconstruct misunderstandings between teams and enable a fresh start where everyone is on the same page and working from a consistent understanding.

At the end of the workshop, you should be able to identify each phase in the customer’s experience, who and what they interact with within your organization, and how you meet their needs along the way.


Keep in mind, for some companies, a workshop is all that is needed to gather internal perspective. On the other hand, sometimes workshops are just the starting place and then require deeper dives with specific departments, business units, or individual role types to further precipitate areas where exploration is needed. So, once your workshop is completed, identify whether or not you need to go deeper, and, if so, what types of roles, departments or business units you need to go deeper with.


Continue to conduct stakeholder interviews until you feel confident that you’ve really mapped out the impact those areas have on the internal customer journey or end customer experience.


Need an example? Let’s talk about articulating underlying assumptions. Healthcare organizations often use the word “encounters” as a measurement for improving patient engagement. However, when we’ve asked organizational team members to define the term, no one in the room has the same definition or knows how to explain it. If everyone perceives and defines a goal and/or measurement like “encounters” differently (or in many cases, can’t define it at all), it’s impossible to know how or when to measure and define success. The solution? Get it on paper (or a whiteboard or shared digital document)! When you put something down in writing and rally around a common definition, you can identify optimal procedures to measure it. This will ultimately contribute to agreeance and alignment necessary for not only standing up successful marketing programs, but proving ROI.

If everyone perceives and defines a goal and/or measurement differently (or in many cases, can’t define it at all), it’s impossible to know how or when to measure and define success.

Step 3: Hone in on the end users

Now it’s time to look beyond the internal perspective and focus the lens on your customers. This requires the most time and could take anywhere from a couple weeks to a couple years to complete, depending on your scope.


Before you get start, there are a few tips to consider that will help you avoid common pitfalls at this stage:


  • Ensure you get to the real root cause of pain or opportunity and don’t get caught in optimizing for the surface level. As with other phases, this requires that you push beyond the surface of what users tell you qualitatively. A great way to do this, no matter what process you use, is to ask “Why?” three to five times. Once a user shares an observation that seems important, ask why. Then ask why again, and again. Many companies gather initial observations and never get to the true root cause, therefore they’re stuck treating only symptoms of problems.
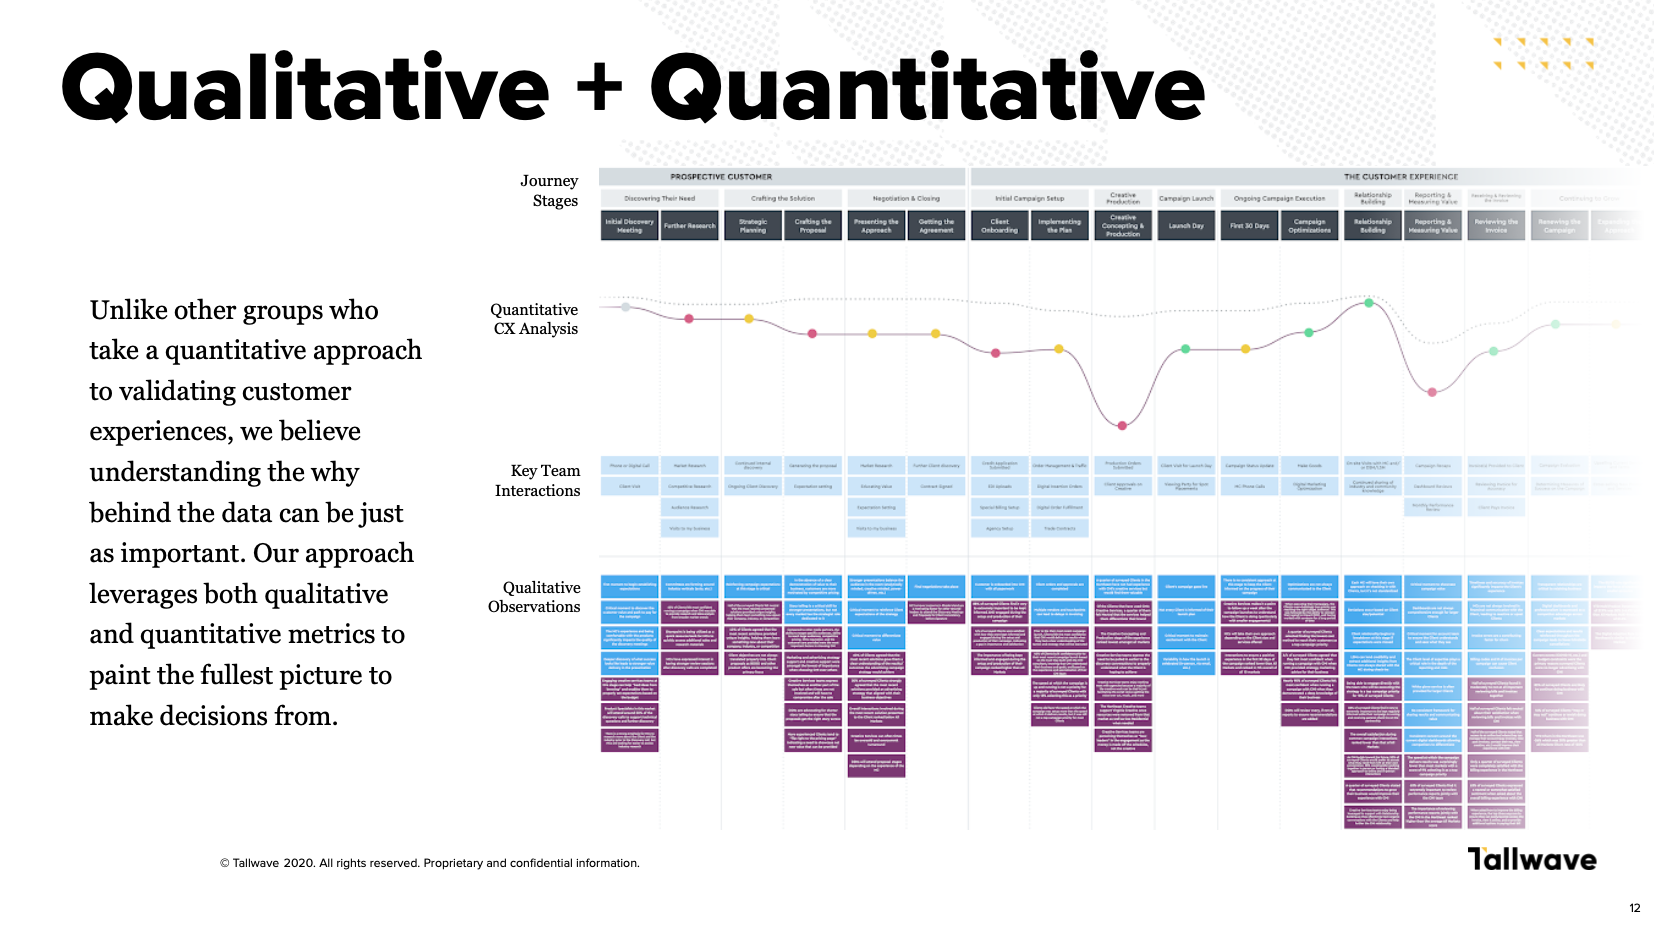
  • Don’t rest on qualitative data. Instead, pair it with quantitative data. Find ways to objectively measure what is happening to your user’s experience at key milestones throughout the journey. We often do this by merging qualitative data with surveys or other analytical data (think customer CRMs, google analytics, website data, or MPS data).
  • Avoid intuition as your primary method of gathering user experience. Qualitative techniques we often employ include interviews, focus groups and ride alongs.
  • Give yourself time to really hone in on the user experience. Many companies never gather this information, at all; instead, they architect their journey based on internal perspective and move forward. It’s always important and useful to get real, quality feedback from end users.
  • Don’t forget that your customer base is diverse. Get feedback from multiple personas as you go.

Also read: Qualitative vs. Quantitative Data in CX Design: Everything You Need to Know


During this phase, you and your team should use qualitative and quantitative techniques (learn more about that here) to obtain real customer feedback by guiding them through each phase of the outlined journey to validate their needs, wants, and experiences. 0 By sitting down with real customers, you’re able to explore their goals and needs respective to your product, services, and/or digital presence. In the end, you’ll be able to expose valuable insights that can drive future focus. Often, this phase identifies opportunities for re-engagement. While your goals may be more specific, it is still important to see the full picture before drawing any conclusions about your overall customer experience. At this stage, compiling as much information as possible is key.


Need an example? Sometimes this phase can give rise to specific problems, including the root cause of customer conversions. One of our clients – a leading nation-wide insurer group of automobiles, homes and small businesses – was seeing a dip in quote yields and overall conversion rates. After doing a deep data dive – using both qualitative and quantitative techniques – we discovered the majority of drop offs were occurring moments before clicking the, “I’m ready to complete my quote” button. Why would users go through the trouble of filling out 99% of the form, only to abandon the process right before getting the information they originally sought? The answer was buried in the messaging.


Qualitative & Quantitative Data Gather | Tallwave

By speaking to customers, we discovered the last question in their quote-request form – one that asked the user if they’d like to enter information to receive additional insurance quotes – was causing feelings of exhaustion and frustration for potential customers. Instead of marking “No,” and continuing on, they simply bounced away from the site – and, likely, with no intention to return. This not only illuminated the main pain point, but allowed us to execute focused competitive analyses to get inspiration from competitors, develop potential solutions, test them, and then launch the solution/s to the market.

Step 4: Review, analyze, and map it out

It’s time to start putting the puzzle pieces together.


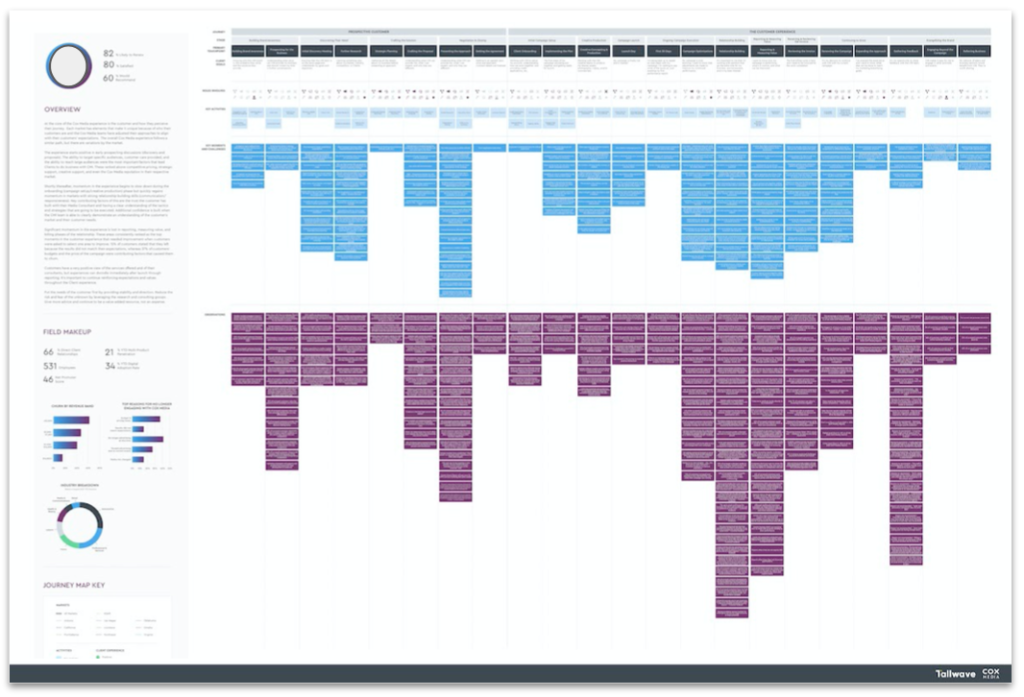
With an integrated team spanning a variety of disciplines (including research, business innovation, experience design, and consulting), review the customers’ experience data from every angle. Doing this will provide a more holistic view necessary for creating a more robust and useful map.


Conduct another workshop to synthesize and compare data from internal and external perspectives on your customer experience.


Starting with the qualitative data, use tools like an an affinity map to clearly identify where your customers’ needs are being met – and where they’re not. This should expose service gaps and highlight opportunities.


Next, test the customer feedback against the internal perspectives map previously created. More often than not, it will reveal discrepancies between what internal teams believe is important, versus what customers really assign value to. This visual approach, while also displaying challenges within the current experience, will make achieving cross-functional alignment around future plans easier.


Also read: Crafting Employee Experiences to Improve Customer Experiences


Keep in mind that the ultimate goal is continual evolution. Take the time to test and, as you do, update your journey map.

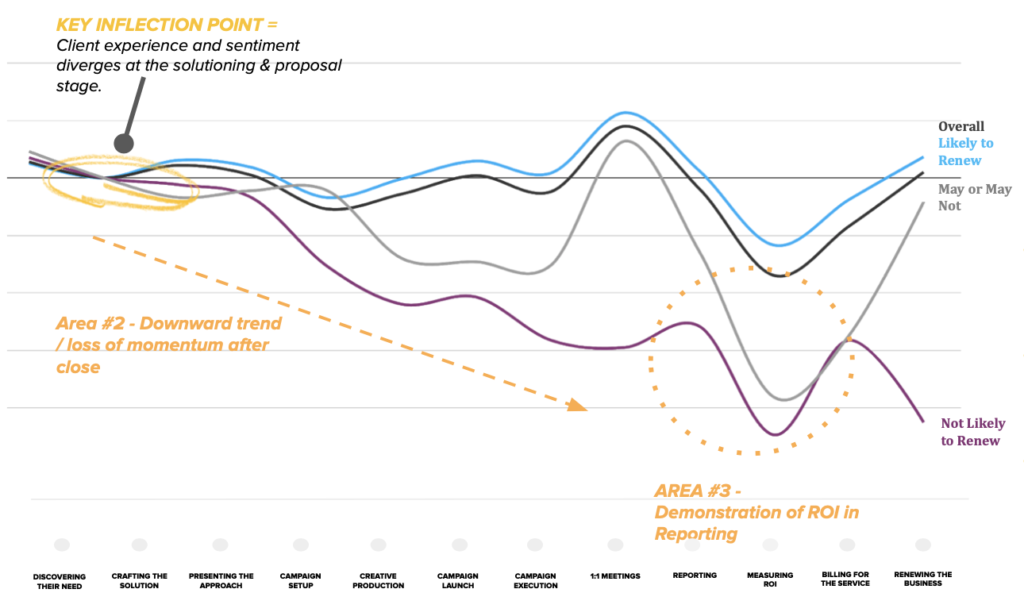
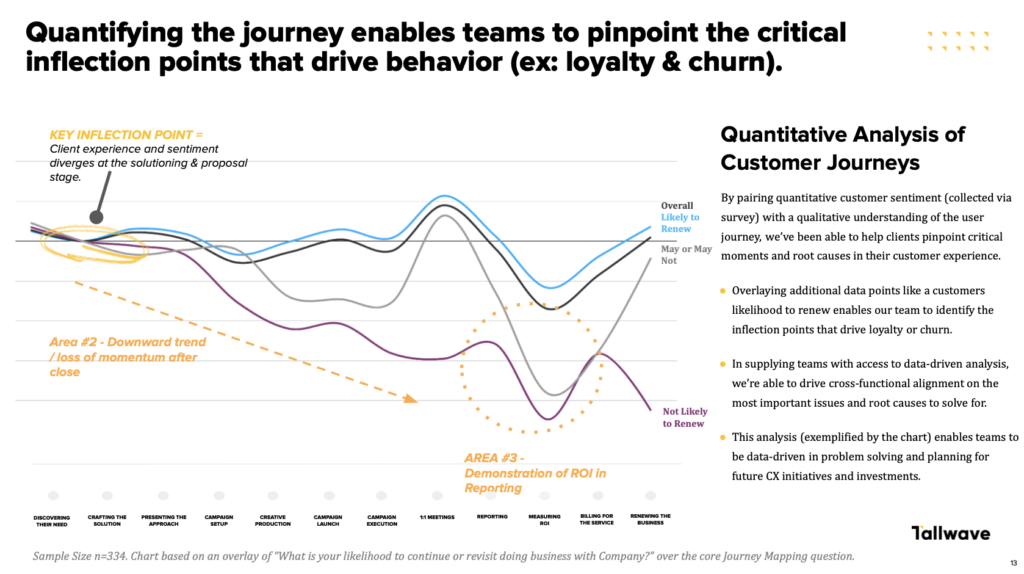
Lastly, to pinpoint exact moments of friction and/or leverage in your customer experience, pair the quantitative data – which analyzes customer sentiment and perspective at every stage and interaction – with your new qualitative understanding of the user experience. By overlaying these data points – like a customer’s likelihood to renew – you’ll be able to pinpoint specific moments that drive loyalty or churn and their financial impacts.


At this point, now all that’s left is to prioritize the areas of opportunity and roadmap short- and long-term focuses to improve business workflow. Keep in mind that the ultimate goal is continual evolution. Take the time to conduct ongoing testing and, as you do, update your experience map.


Need an example? A major broadband communications company who had been in the business of delivering entertainment and connection companies and companions long before the internet existed was struggling with gradual increases of customer dissatisfaction and churn. Month over month, the company’s acquisition and retention numbers decreased. Thei business and market share was at risk. By pairing quantitative sentiment with our qualitative understanding and visually mapping both, we were able to pinpoint the main points of friction that we needed to solve for: Severe client and market variability, inconsistent structure and resources a reactive servicing model, disparate systems and processes, a need for continued product training, and shifting client expectations. To summarize, the experience being delivered was afflicted with challenges and creating volatility throughout the journey, ultimately contributing to churn.


Qualitative Analysis of Customer Journey | Tallwave

By outlining the specific issues, we were able to build a path forward to develop a proactive and consultative CX that focused on the most essential needs, including:

  • Elevating the customer care solution to create a repeatable experience that promotes consistency while preserving autonomy
  • Simplifying the employee experience to reduce friction by streamlining backend systems and processes
  • Modernizing client interactions with omnichannel and digital-forward experience
  • Invest in delivering an experience that is predictably proactive and drives consultative value
  • Clearly demonstrating the ongoing value of partnering with a customer care solution

Pinpointing the needs and developing solutions enabled us to become part of the client’s strategy, not just a one-off tractic. Next, we built a roadmap that encompassed recommended initiatives, identified workstreams, defined what success would look like and outlined how the work would enable continual program evolution.

The Bottom Line

By consistently completing the customer experience mapping exercise (don’t set it and forget it!), you can empower your team to problem solve from a data-driven perspective and establish plans for future CX initiatives and investments.

At the end of the day, customer experience mapping is about connecting with your customer, and deeply understanding and empathizing with their needs and wants. If your company can prioritize solving customer’s problems as the world evolves, you’ll set yourself up for unstoppable momentum.

Categories
News This Week in CX

This Week In CX: Mylk Tries to Be Funny, Masks Get a High-Tech Upgrade & More

Recently, a couple people have asked us what customer experience encompasses and why we select the stories we do for This Week in CX… afterall, they really run the gamut! From news about advertising campaigns to product development, rebrands, research, and algorithm updates, they speak to every sector of a company’s business and growth milestones. But the reason for that is quite simple: Every single interaction and/or touchpoint a potential or existing consumer or client has with your brand factors into your overall customer experience. The quality of the experience – whether it’s friction-less and purpose-driven, or full of frustrating, confusing, or triggering moments – continuously informs and evolves a customer’s perspective and affinity for your brand.


And the minute details – the words and images used in the messaging, the colors chosen for design, the tools used to deliver customization and personalization, the ease of navigation and product design, the foresights into changing consumer behaviors and expectations, the optimization that enables discovery and education – it all impacts a customer or consumer group’s experience with you. Like we always say, #ExperienceIsEverything.


Extreme care and intention must be carved into every business decision made, whether it obviously impacts the external customer, or not (because hint: employees are the drivers of experience and if they’re not happy, we bet you’ll notice a trickle-down effect). Cross-functional alignment on values, purpose, mission, voice, and personality is essential to providing consistent experiences that build rapport, dependability, and advocacy.


Also read: How to Craft Employee Experiences That Improve Customer Experiences


Hopefully, with that explanation, we’ve made our why behind the stories we choose a little easier to understand (if you’re still confused, we’d love to continue the conversation! Send us a DM here, here, or here). So, without further ado, here are the biggest product, marketing, and research developments that occurred this past week and will most certainly inform how we design and deliver the customer experiences of tomorrow.

The quality of the experience – whether it’s friction-less and purpose-driven, or full of frustrating, confusing, or triggering moments – continuously informs and evolves a customer’s perspective and affinity for your brand.

One Milk Alternative Brand Took Transparency to an Udderly Risky Level (Or Did They?)


Companies by and large have had to get creative with their marketing efforts as work-from-home and social distancing mandates have continued as our new normal. For example:


Apple released a commercial that showcases a slideshow of photos and videos – safe to guess all shot on iPhones – with the message, “Creativity goes on.” While simple, it does the job. Some of us may or may not have felt a little choked up.

Women’s Aid – a UK-based organization that provides live-saving services to those impacted by domestic abuse – took to the streets to capture footage of empty sidewalks, parks, stripmalls and sqaures. In between the commercial’s montage, simple white letters appear on a black screen that read, “Domestic abusers are no longer walking among us. They’re locked inside with their families.” A sobering reminder and plea to donate to help women and children in our communities whose homes are anything but safe.

Coors Light turned one Grandma’s tweet into a massive social campaign (and free beer spree) that ultimately raised brand awareness and customer sentiment. After 93-year old Olive Veronesi posted a photo with a beer can in one hand and a sign in the other that read, “I need more beer!”, Coors was quick to jump into action.

Grandma holding Coors Light and I Need More Beer sign

They delivered 10 cases to Olive’s doorstep (to which she posted another picture with an updated sign, “Got More Beer!”) and started a Twitter giveaway – one that resulted in dropping off a whopping 500,000 beers to people’s doorsteps – with the #CouldUseABeer hashtag.

Twitter #CouldUseABeer tweet

So, with creative ad campaigns piling up, what’s a new brand – who can’t supply samples in grocery stores to potential consumers but wants to make a splash in the marketplace – to do? Lean in, take risks, and follow the lead of the unconventional.


Milkadamia, a new nut-based milk alternative brand, introduced itself with a little transparency and light-heartedness. Afterall, we’ve all had a very serious year. They recruited seven Chicago-based comedians and sent them boxes of unidentified food items. The comedians (read: not scripted actors) were told to unbox the items and try them. On-camera. That’s it.


They called it the “Just One Taste LIVE campaign” and, while they aimed for authentic reviews of their products – ”I won’t say I wasn’t anxious,” CMO Christina Downey said – they also did some good by paying out-of-work improv actors to sit in their PJs and drink Milkadamia’s new macadamia nut milk. Although, just to be clear, none of them were actually wearing PJs. They look quite presentable in the final video. Which, come on, making the rest of us sitting in three-day old sweat pants look bad.

The campaign’s goal was to open people’s minds up to the possibility of plant-based milks, and while they may have achieved that, some Tallwave experts felt the campaign fell a little flat.


“The idea is good… But to be totally honest, the video feels kind of forced,” reviews our Manager of Content Strategy Holly Ringerud. “I know they said it was unscripted, but it’s obviously edited and everyone is well-lit. It’s just not as high concept or entertaining as I think it could have been.”


She finished: “But it’s an interesting update on the ol’ taste test!”


So, there’s that.


Our Director of Operations Kailen Campbell also loved the idea but was left wanting more. The biggest problem? It didn’t stay true to the campaign’s name and promise.


“The video campaign says it was ‘recorded for subsequent public distribution,’ right? So, this was not truly a live event – despite being called ‘Just One Taste LIVE’ – where people like me could join the Zoom and watch the big names taste everything in real-time,” Kailen pointed out. “Believability matters a whole lot with things like this.”


She did have some kudos to give.


“Creative? Totally! Unique? Yep. Good for them for giving us all something a little different.”


But it was actually another Milkadamia video that sparked greater interest in the brand and product for Kailen.


“I actually really enjoyed the educational promotional video more. I don’t know much about milk alternatives. I drink cow’s milk! So, the educational information made more of a lasting impression on me.”


It seems unanimous. A for creativity. A for taste. C for execution. Sorry, we can nut lie.

Facial Masks Get a High-Tech Makeover

Bonatone, a British electronics firm, recently released a high-tech, protective face mask that solves a pain point all mask-wearers have encountered at least once. With earbuds and a microphone built-in, Maskfone gives multitaskers the power to stay safe while continuing conversations – or listening to music, podcasts, etc. – while on the go. As CreativeBloq [https://www.creativebloq.com/news/maskfone-ultimate-face-mask] put it, “Anyone who has tried removing a mask with music plugged in will know it’s a recipe for lost earbuds, while trying to speak on the phone through a mask is a recipe for a sore throat.”

Simply put: Bronatone developed a product with hopes of changing the experience humans have with their protective masks, whether on a jog, at the grocery store, or taking a professional call while chasing a kid around Target.


But the real question of the hour: How has the pandemic changed people’s perceptions of crowds, germs, and distancing, and will newly-acquired safety-precautions – like wearing masks – continue once the threat of COVID-19 has passed?


“I think people will be more mindful about cleanliness – continuing to use hand sanitizers and wipes – while in public places and crowds. Companies may continue to offer sanitizing products to the public. I also foresee virtual experiences, such as Telehealth and contactless options continuing,” says Jenny Alexander, Product Designer at Tallwave. “But I definitely don’t see the use of masks persisting once the pandemic is resolved. There is already a lot of resistance to wearing them. Potentially a few extra cautious people may prefer wearing masks, but I only see the trend lasting for a short period in the post-pandemic world.”

Well, hopefully for Bronatone’s sake, the mask – which is made with four filter layers, washable and water-resistant fabric, comes with a variety of ear hook sizes and features controls buttons on the side, along with an app that can boost the speaker’s voice – sells out before we all go back to living the unmasked life.


Also read: How to Brainstorm For Innovation 


Speaking of COVID-inspired items… Has anyone created the bottomless toilet roll yet? Now, that’s a life-changing invention right there. 

New Survey Reveals New Charitable Donor Insights 

Data Axle released a new report titled New Best Practices to Connect With Today’s Charity Donors that highlights current behaviors, preferences, and sentiment among today’s charitable donors, particularly as they vary by age, gender, income and political affiliations.


Being that we work closely with a couple nonprofits and charitable organizations to improve their donor acquisition, digital footprint, and reach new (younger) audiences, we were interested.

"It all comes down to a charity’s customer experience."

Some key takeaways shared in the report include:


  • Preferences surrounding donation channels vary by age; 45% of donors 60+ prefer sending donations via mail; while all demographic groups between 18-60 prefer making donations by going to a nonprofit’s website unsolicited and donating online (ahem, a strong digital experience – and digital brand awareness strategy – is key).
  • Young donors (18-44) favor making monthly contributions to charities of their choice – it’s all about ease through recurring (subscription-like) models these days.
  • Omnichannel strategies and cross-channel communication is crucial. Email, direct mail, and social media were reported most important – with basically no one wanting to receive phone calls. However, and potentially most important, according to the report, donors prefer to “receive communications via one channel and donate through another, [so] synchronized cross-channel strategy is vital.”

“These findings do align with what we’ve seen through our partnerships and respective campaigns with donor-dependent nonprofit and charitable organizations,” says Tallwave Consultant Benjamin Pressman. “It all comes down to a charity’s customer experience. The starting point has to be internal alignment on what success looks like. This evaluation must rely on factoring the lifetime value of new donors into acquisition costs. In our experience, nonprofits can’t rely on each individual acquisition channel delivering a positive return, but instead need to, at a minimum, combine all acquisition and retention efforts’ costs to view the overall lifetime value return. More sophisticated evaluations can be developed to understand the influence each channel has on initial donation and retention of donors, but there needs to be an understanding that all channels contribute to the overall revenue brought in from donors.”

"In our experience, nonprofits can’t rely on each individual acquisition channel delivering a positive return."

And while cross-functional alignment and a defined roadmap for success and ROI is key, so is crafting a personalized, seamless cross-channel experience that encourages donations, as well as engagement and advocacy.


Also read: Optimizing paid media strategies for a 40,000% increase in leads


According to Benjamin (Benjie, as he’s known around the now-virtual office), there are two steps organizations should take to improve their cross-channel experience.

“The first is focusing on the current donor base and finding similar donors:

  1. Charities should analyze their current donor base and find common factors to acquire similar audiences that provide the needed long-term return in revenue
  2. Building in audience analytics to the acquisition funnel will also help charities understand where the pain points are in the prospect CX, and test and learn to alleviate those pain points
  3. Similarly, retention efforts’ pain points should be be evaluated through customer research to inform improvements in retention efforts

These efforts will provide the roadmap to acquiring new donors that align with the existing donor base. Then, charities should use 3rd party research to identify who their new donors likely are. Based on that determination, a new CX flow should be created to accommodate expectations for that audience. This could be a simple tweak of existing creative assets and site content, or a need to more broadly create new experiences.”


Helping nonprofits and charitable organizations expand their reach and deliver their mission to more audiences is something we’re so incredibly proud of and passionate about. We hope to use these new findings to continue that pursuit and drive more unstoppable growth, change, and impact.

Categories
Strategy

Qualitative vs. Quantitative Data In CX Design: Everything You Need to Know

This is a common issue for many organizations, big and small, but it’s not an impossible one to solve!


If you’re experiencing a similar situation, you need to invest in gathering persona data that will not only tell you who your customers are and what they care about, but why they care and how they expect brands to make them feel.


To get started, let’s define each set of data, how it’s gathered and what it’s used for.


What is qualitative data?

Qualitative data – or primary data – is commonly gathered by businesses and plays an important role in understanding target audience sentiment and informing customer journey design. By conducting unstructured or semi-structured first-person user interviews, discussions, on-site observations, in-house moderated user testing, web analytics, and focus groups, qualitative data-collecting techniques allow companies to interact directly with their key customers, see how they’re using their products or services and receive feedback in real-time. It helps define the customer journey and establish an initial foundation and understanding of all internal and external customer experiences.


There’s just one problem: Sometimes people don’t know what they want, don’t have the words to truly express how they feel, or simply, aren’t honest.


That’s when quantitative data comes in.

Quantitative data enhances primary research and design efforts by quantifying key problem areas.

What is quantitative data?

Quantitative data – which can be gathered through a variety of structured surveys, questionnaires, and polls – is essential secondary research. When transformed into statistics, it enhances primary research (qualitative data) and design efforts by quantifying key problem areas. It also allows marketers, developers, business leaders and customer experience drivers to peer into customer details, attitudes, and behaviors from a data-driven standpoint, and test hypotheses established from qualitative data.

Qualitative Data vs. Quantitative Data: When Should You Use Each & How?

Let’s start with the when. To craft the best customer experiences, companies should collect and analyze both data sources on an ongoing basis. Because – and this is a big one – audiences and their expectations are always changing. By executing primary and secondary research to gather qualitative and quantitative data, companies make themselves better equipped to not only identify, but truly understand their customer base – how they interact, experience, and feel about a website, application or overall brand.


And don’t forget to gather employee input, as well! Employees are often the first to know what’s working and what’s not. Most organizations shy away from gathering input from employees, but in our experience, leveraging this powerful knowledge base sooner rather than later helps identify root challenges and opportunities to improve faster and more effectively.


Also read: Crafting Employee Experiences That Improve Customer Experiences


Now, the how. After both qualitative and quantitative data has been collected, follow these steps:

Map your qualitative data

Example of mapping internal & external qualitative data

Using the qualitative data gathered, map internal perspectives around critical touch points and test it against customer feedback that was collected. This should reveal discrepancies between what internal teams believe is important, versus what customers assign value to. By taking this qualitative approach, teams can visually display opportunities and challenges within the current experience. Providing a picture that illuminates the differences between internal and external stakeholder perception makes achieving cross-functional alignment on future plans easier. There’s not a whole lot to argue about when the writing’s on the wall.

Pinpoint exact moments of friction and/or leverage in your customer journey

Utilize quantitative methods via surveys and other previously mentioned techniques to analyze customer sentiment – opinions and responses – as well as perspective at every stage of the journey. Keep in mind, each interaction a consumer can have with your brand, both passive and active, is a touchpoint and part of your overall brand journey. Therefore, every interaction must be diligently and continuously monitored, evaluated and iterated because one singular touchpoint can cultivate customer affinity or aversion.

Pair quantitative customer sentiment with a qualitative understanding of the user journey

Pairing qualitative and qualitative data

Quantifying the customer journey creates a data-driven understanding of the critical inflection points that drive loyalty and churn. This naturally illuminates root causes of friction (or conversion!) and enable teams to be data-driven in problem solving and planning for future CX initiatives and investments.

How To Use Qualitative & Quantitative Data To Decide on Next Steps

At Tallwave, we create an ‘Impact Matrix’ – this tool highlights opportunities for improvement and compares the impact they’ll each have against the level of effort and investment they’ll require. This helps create alignment and buy-in for low-risk, high impact initiatives that are critical to shaping and improving the customer experience.


Find a similar exercise or tool to visually demonstrate all the opportunities that lie ahead and inform the build of a new strategic roadmap that can take your teams and company into the future.


Perhaps most importantly, don’t let perfection get in the way of progress! Making big system changes to your end-to-end user experience may take time, but avoid trying to solve it all at once. Identifying the biggest opportunities and making incremental improvements over time, while learning along the way, will make a huge difference.


Last but not least, don’t stop. This isn’t a “set it and forget it” game. Customer behavior – be it with an existing website, application or with a brand across numerous touchpoints – must be closely monitored to ensure both user and business goals are consistently met. If they’re not, all teams – Content Strategy, Product Development, People & Culture, Performance Marketing – must align to identify solutions for evolution and continue growth.


Also read: Why Customer Experience Can’t Be All Data-Driven

Don’t let perfection get in the way of progress! Identifying the biggest opportunities and making incremental improvements over time, while learning along the way, will make a huge difference.

Bottom Line

Let data be your guide. Qualitative input is key, especially early on, but also leverage quantitative data as much as possible to make decisions. The combination of qualitative and quantitative helps you identify where there is friction, but also gives you the context you need to develop solutions that hit the mark. And if you don’t have the right data infrastructure set up today, that’s a good place to start.

If you need help collecting, comparing and mapping your qualitative and quantitative data to improve your customer journey and overall experience, contact our team today!

Play Video

Bunger Steel

Doing some things and making some impacts