Over the past few years marketing and IT teams have been flying high with cloud-based innovations. These servers and software “in the sky” are aimed at improving flexibility, scalability, and efficiency of handling and accessing the data that empowers marketers to make the informed decisions they need to reach their target audiences and provide great consumer experiences. From collecting and storing paid media analytics to scheduling automated campaigns, the cloud seems to be the key fueling your brand’s digital ascent.
But as you soar amidst the data-driven clouds, a question whispers in the wind: is your data safe?
Enter cloud security management, the vigilant guardian in this digital sky. It’s the framework, the set of tools, the sleepless protector ensuring your prized marketing data navigates the cloud with confidence and integrity.
The cloud security landscape: From seedling to towering tree
Cloud security’s journey began decades ago, as a tiny sapling sprouting from concerns about online data vulnerability. Today, it stands tall as a mighty oak, offering robust solutions across industries. But for marketers and IT teams who rely on high-quality data to drive actionable insight, understanding where you are in this forest is crucial. Are you just planting the seeds of cloud adoption, or do you have sprawling data ecosystems nestled within its branches? Identifying your stage sets the foundation for your cloud security management journey.
Understanding data protection: The roots of secure marketing
The heart of cloud security management is data protection. For many marketing teams, this translates to safeguarding customer information, campaign creatives, and brand-sensitive data. For others, like those who rely on healthcare web analytics data, the roots are even deeper.
However, cloud security management isn’t without a few thorns. Today’s marketing landscape throws myriad security challenges our way:
Evolving threats: Hackers, malware, and data breaches constantly evolve, demanding dynamic, adaptable security measures.
Fragmented ecosystems: Multi-cloud environments and third-party integrations multiply data touchpoints, creating a complex security puzzle.
Human error: Accidental data leaks or inadequate employee training can unintentionally expose vulnerabilities.
To combat these growing threats, marketing and IT teams might consider an approach with two branches:
1. Data classification and encryption
Prioritize your data, classifying it based on sensitivity and implementing robust encryption measures for high-value information. Secure cloud storage solutions further solidify your digital fortress.
2. Cloud security standards
Adopt industry-standard practices like strong password policies, access controls, and regular security audits. Remember, prevention now is always better than breakfixes later.
So, having acknowledged the critical role of data protection, the question that begs to be asked is: how can we actively implement best practices and tools to build a data sanctuary within the cloud that protects and enables our marketing initiatives?
Best practices for cloud security management: Building your data a secure shelter
Let’s delve deeper and explore the practical tools and best practices marketers and IT teams can leverage to ensure data stays safe in the cloud.
Cloud security monitoring and threat detection
Invest in tools that continuously monitor your cloud environment for suspicious activity and potential threats. Early detection is key to swift and effective containment. Tools can vary by cloud provider. Those using AWS might look to GuardDuty or Amazon Inspector, while those on Azure might consider Microsoft Defender for Cloud or Log Analytics.
Future-proof your environment
Stay ahead of the curve by constantly evaluating and updating your cloud security measures. Remember, the digital landscape is ever-shifting, and so must your defense mechanisms.
Secure cloud storage
Choose reliable cloud storage solutions that offer robust security features, data redundancy, and disaster recovery options. Your marketing data deserves a digital vault, not a cardboard box.
Cloud security policy
Craft a comprehensive cloud security policy that outlines data handling procedures, employee training protocols, and incident response plans. Clear guidelines are your best friend in crisis mode.
Regulations like GDPR and HIPAA add another layer of complexity to the cloud security puzzle. Risk management in cloud security is key, by regularly assessing compliance and actively managing potential risks, you can chart a secure course through the regulatory waters. Other guidelines, like SOC 2 and ISO 27001, provide a roadmap for achieving and maintaining compliance, earning you precious trust and peace of mind.
Embarking on your secure cloud journey
Cloud security management may seem daunting and like a maze of risks and regulations. But remember, you don’t have to navigate it alone. Cloud security solutions abound, offering tools, expertise, and managed services to guide you every step of the way.
At Tallwave, we understand the intricacies of cloud security, especially in the dynamic world of digital marketing. Our team of marketing data strategy experts is ready to equip you with the knowledge, tools, and confidence to conquer the cloud’s highest peaks. Tallwave is just a cloud hop away; we’re here to help when you need us.
Now that we’ve all had a few months of working exclusively within Google Analytics 4 (GA4), it’s worth taking a moment to explicitly define some of the new metrics within the platform and how they compare to Universal Analytics metrics.
As clients and marketers navigate this transition and consider these metrics, understanding their distinct functionalities and how they diverge from their Universal Analytics counterparts becomes paramount for harnessing the true potential of GA4. This is especially true when it comes to metrics related to average duration.
Decoding the differences between Universal Analytics and GA4 metrics
In Universal Analytics (sometimes called GA3), metrics like Average Time on Page and Average Session Duration were widely used to measure user engagement. However, with GA4, there’s a shift in how engagement and user behavior analytics are measured. GA4 introduces Average Engagement Time, which is an entirely different way of measuring user engagement. Let’s compare the differences with the new metrics in GA4.
1. Average Time on Page vs. Average Engagement Time
In Universal Analytics, Average Time on Page measured how long users spent on specific pages. It was calculated by measuring the time between consecutive pageviews, assuming that the last page of a session didn’t require a subsequent view. However, GA4’s Average Engagement Time takes a more nuanced, user-centric approach. This metric assesses the actual time a user actively engages with the page, disregarding instances where the tab loses focus. For instance, if a user switches to another tab or app, GA4 doesn’t consider this time in the calculation, providing a more accurate depiction of user interaction and true engagement duration. Let’s take a look at more examples below:
Average Time on Page (Universal Analytics):
Calculation method:
Utilizes the time between two-page hits to compute the average time on a specific page within a session.
Measurement Scenarios:
Sequential Page View Scenario:
Scenario: User visits “Page A” for 10 minutes, moves to “Page B” for 25 minutes, and leaves.
Calculation: “Page A” registers a time on page of 10 minutes, but with no next page to feed into the model, no time on page data is captured for “Page B.”
Interruption In Session Scenario:
Scenario: User spends 5 minutes on “Page A,” switches to another site for 5 minutes, then returns to spend 25 minutes on “Page B.”
Calculation: “Page A” registers a time on page of 10 minutes, but “Page B” remains unmeasured due to interruption.
Bounce Scenario:
Scenario: User bounces from “Page A” after spending 30 minutes, with no subsequent page views.
Calculation: “Page A” shows no recorded time due to the absence of subsequent page visits.
Average Engagement Time (GA4):
Calculation method:
Measures the average length of time the website remains in focus in the browser, excluding time when the tab loses focus.
Accurate measurement scenarios:
Sequential Page Views:
Scenario: User spends 10 minutes on “Page A,” then 25 minutes on “Page B.”
Scenario: User spends 5 minutes on “Page A,” loses focus for 5 minutes, returns to spend 25 minutes on “Page B.”
Calculation: “Page A” accounts for 5 minutes, while “Page B” registers 25 minutes.
Bounce Scenario:
Scenario: User spend 30 minutes on “Page A” then bounces.
Calculation: “Page A” registers 30 minutes.
2. Average Session Duration in Universal Analytics vs. GA4
The Average Session Duration in Universal Analytics was a fundamental metric used to gauge overall session length. It calculated the total duration of a session from the first to the last hit, including the time spent on exits or bounces. Conversely, GA4 approaches this with a subtle yet crucial difference. Instead of calculating the entire session time, it focuses on active engagement within the session, excluding periods of inactivity or when the browser tab loses focus. This shift emphasizes active engagement, providing insights that are more indicative of genuine user interest and intent.
3. Implications of transitioning metrics
The transition from Average Time on Page/Average Session Duration to be more focused on Average Engagement Time results in some implications for Marketers who are trying to interpret user behavior. The new methodology in GA4 aligns more closely with actual user engagement, offering a more precise view of user interaction on the website. This transition necessitates a shift in perspective, especially for those accustomed to Universal Analytics metrics. Embracing this change unlocks the potential for more accurate insights into user behavior, ultimately empowering businesses to tailor their content strategies more effectively based on genuine user engagement patterns.
This shift in perspective empowers marketers and businesses to ditch vanity metrics like average pageviews and prioritize meaningful interactions. They can craft targeted campaigns based on engagement patterns, identify conversion pathways hidden in passive metrics, and ultimately, drive growth based on genuine user interest.
So long Universal Analytics, it’s time to embrace GA4 and all that comes with it
As we bid adieu to the familiar metrics of Universal Analytics and embrace the increased customer centricity of GA4, it’s like saying goodbye to an old friend and welcoming a more insightful companion. The shift from both Average Time on Page and Average Session Duration to Average Engagement Time empowers marketers to better understand true user behavior.
By equipping yourself with the right tools and knowledge, you can leverage GA4’s advanced capabilities to gain a deeper understanding of user behavior to uncover hidden conversion paths and personalize experiences for targeted segments. Embracing GA4 and its new measures will also let you prepare for the future of digital analytics with a platform built for flexibility and adaptability. And you don’t have to go at it alone. We’re just a click away and can help you build a meaningful data strategy that enables actionable insight.
In today’s complex and ever-evolving digital landscape, understanding the nuances and differences between omnichannel and multichannel marketing is essential to providing your customer with a great experience. It’s more than just a battle of the buzzwords; marketers need to understand that omnichannel marketing is the natural evolution of its predecessor, multichannel marketing.
This isn’t about picking one over the other; it’s about embracing the journey toward a more sophisticated, integrated approach that better meets consumer expectations. We’re talking about a strategy that resonates deeply with today’s customers who crave not just interactions but meaningful, connected, personalized experiences across multiple touchpoints in the channels of their choice. It’s about painting a bigger picture, where every channel tells a part of your brand’s story, cohesively and compellingly.
You might think of multichannel marketing like a single-round sparring session. You make the best use you can of marketing strategies and techniques within a single round (or channel), learning and iterating on the fly without the benefit of insight into how a given sparring partner (consumer) has behaved in other rounds (channels). Omnichannel marketing is more like a multi-round professional prize fight where marketing heavyweights consider their opponents’ moves in each round so that, round to round (or channel to channel), their marketing strikes are strategically choreographed around their expanding knowledge of consumers’ preferences and prior actions.
By the book: Omnichannel vs multichannel marketing
“Omnichannel” and “multichannel” are often mentioned when discussing digital marketing strategies. But there’s not always a clear distinction between the two approaches. Let’s cut through the confusion and clarify what omnichannel marketing and multichannel marketing actually are.
Multichannel marketing refers to using various channels — paid and organic search, social media, email, or even in-store experiences — to engage with customers. It’s about being present and visible in multiple places, but often, these channels operate in silos with strategies that consider the best practices for each individual channel, but don’t connect to touchpoints consumers have with the same brand in different channels at different stages of their journeys.
Omnichannel marketing takes a more holistic and customer-centric view. It’s not just about being present on multiple channels; it’s about creating a seamless, integrated experience across all touchpoints that reflects customer preferences and behaviors across channels. Omnichannel commerce ensures that whether a customer interacts with your brand online, through an app, or in a physical store, their experience is consistent and interconnected. An omnichannel marketing strategy ensures that customers receive an experience that’s brand-consistent no matter the channel but personalized to them based on real-time interaction across channels as their behavior evolves, aiding in their decision-making process, and encouraging high-value actions.
With these definitions and differences in mind, you can put your marketing strategy on the path to omnichannel prizefighter status.
Four ways omnichannel marketing can give your strategy a fighting edge
Exploring the differences and nuances between omnichannel and multichannel marketing isn’t just academic or informative; it serves as a practical guide to aligning your marketing strategy with the evolving expectations of today’s consumers and taking an integrated approach.
There are several ways omnichannel methods can level up your marketing strategy, from focus to flexibility:
1. Focus: Product vs. Consumer
In multichannel marketing, the focus often leans toward the product, service, or brand. Each channel works independently to highlight the offering, sometimes leading to a disjointed customer experience.
The hallmark of an effective omnichannel strategy is its integrated nature. Unlike multichannel strategies where each channel might operate in a vacuum, omnichannel marketing strives for connection. This integration means data and insights are shared across channels, ensuring that the customer journey is not just multichannel but truly interconnected.
Consider this example: a customer visits an e-commerce apparel website and visits the product page for a particular top. They even add the top to their cart, but ultimately abandon it before completing the purchase. The abandoned cart and purchase history data is used to trigger retargeting and the consumer sees an ad for that same top later on Facebook. It also triggers an email reminding them of the item in their cart. A few days later, they receive an exclusive promo text with a discount that applies to the time in their cart. In this example, we have a consumer interacting with a brand on three different channels, website, social media, and text. With an omnichannel strategy, every one of these touchpoints reflects the consumer’s preferences (they’re interested in tops), behaviors (they showed interest in a particular top), and journey stage (adding the top to the cart suggests an intent to purchase). Data makes it possible.
3. Personalization: Tailored vs. generalized
Personalization is the heartbeat of omnichannel marketing. While multichannel marketing can sometimes result in generic messaging across various platforms, omnichannel marketing leverages data from all touchpoints to create a tailored, personalized experience. It’s about understanding the customer’s journey and reflecting that in every interaction at every stage of the funnel.
To understand what that looks like in practice, consider the previous example, but this time imagine that the reason the consumer visited the e-commerce apparel website in the first place was that they received a text message announcing the the arrival of a new spring collection triggered by the fact that multiple months had passed since the consumer’s last purchase. And imagine that when they landed on the home page, they were greeted by featured products personalized for them based on past site and purchase behavior. That’s omnichannel marketing at work to create a highly personalized experience powered by an integrated data strategy.
4. Flexibility: Controlled vs. Agile
Omnichannel marketing is inherently more flexible and agile compared to its multichannel counterpart. With the latter, strategies are often rigid, with each channel functioning within its predefined scope and data being collected and housed in channel-specific silos. Omnichannel marketing, however, thrives on adaptability, responding in real-time to changes in customer behavior.
Consider this last example: a customer visits a software company’s website and reviews two related products on the website. Not finding quite enough information to decide between them, the customer clicks into the website’s chatbot to ask some questions about the two products. Because there’s some complexity to the answers, the chatbot escalates to a live sales rep. Rather than greeting the customer with a “How can I assist you today?” the rep greets the customer by saying they understand the customer has questions about two products, mentioning them by name. And in addition to answering the customer’s questions, the rep highlights the new integrations on one of the product offers with another that the customer purchased several months ago. That’s the power of omnichannel marketing to an exceptionally personalized, integrated, and customer-centric experience in real time.
Embracing the right approach in your marketing strategy
Embracing omnichannel marketing means you’re not just using multiple channels; you’re masterfully blending them to create a narrative that speaks directly to your customers. It also means you’re reaping the benefits of an omnichannel approach to data and analytics that creates a 360-degree view of the customer, making omnichannel customer experience possible. It’s a savvy move for any marketer aiming to make a real impact in this digital age. This holistic, customer-centric approach is not just the way forward; it’s the key to unlocking deeper connections and lasting loyalty with your audience.
Giving your digital strategy a bright future
As we look ahead to the future of digital marketing, the trend is clearly skewing toward more integrated, personalized experiences. Brands that understand and implement omnichannel strategies are poised to build stronger connections with their customers, leading an optimized conversion journey and enhanced brand loyalty.
Whether you choose omnichannel marketing, or want to innovate further with a convergent commerce approach, you should always focus on delivering value to your customers. By understanding the nuances of each approach and aligning them with your business goals and customer expectations, you can create a marketing strategy that not only meets the demands of today’s digital landscape but also sets the foundation for future growth and success. And with a mature data strategy that prioritizes a single source of truth for customer data, you can bring that strategy to life.
And you don’t have to go at it alone. From increasing visibility with future-proof SGE-informed search strategies to embracing data centricity, Tallwave is eager to implement digital marketing strategies that align with your consumers and meet them where they are when they need you most. Let’s talk.
As we draw near the close of 2023, our sights are set on the year ahead and in true Tallwave fashion, we’re turning our focus to the challenges and possibilities of a new year. But before we run headlong into 2024, we’re taking a moment to reflect on all we accomplished this year.
Our incredibly talented teams executed high-value work that made a real impact on our clients’ businesses. The brilliant thought leaders among our ranks contributed knowledge to the benefit of prospective clients, partners, and business leaders of all stripes. And Tallwavers at every level of the organization seized opportunities to learn, develop, and grow, demonstrating that our value of relentless pursuit isn’t just a series of words, but words we live by. In the spirit of honoring auld lang syne (times long past), here are the highlights the Tallwave team will be toasting as we ring in the new year.
Creating value for our clients
Looking back over our work in 2023, data enablement and modernizing the technology and strategies for delivering on customer needs stand out as themes in some of the most ambitious challenges we helped our clients tackle.
Powering up a customer portal strategy
In 2022, we were engaged by a private, independent energy company with over 35 years of experience in the industry. They’d always been technology-forward thinkers, and their customer connect portal was already a differentiator that set them apart from competitors and contributed to their number one ranking in the industry for customer service. As a tech-forward company, they were planning for ongoing evolution of their portal into a best-in-class solution that continued to meet the needs of their customers.
After evaluating their portal and making strategic recommendations in late 2022, the stage was set to translate strategy into action in 2023. Over the course of the year, we’ve worked with our client to design, test, and validate a new customer connect portal 3.0 solution, implement a measurement strategy to evaluate the performance of the new portal solution, and provide ongoing analytics maintenance, reporting, and strategic insights for a portal that’s always evolving, improving, and creating value for our client’s customers.
Enabling growth through an upleveled internal asset management strategy
One of our largest, most complex clients, a multinational financial services corporation, enlisted our help to establish the proper team and organizational structure, improve data quality to unlock insights that empower decision making, standardize global policies and procedures, and strengthen relationships that align into the broader enterprise with the right engagement models. These desired outcomes coincided with an increase in demand for internal technology assets, intensifying hardware budget management demands, and the increasingly complex logistics for supporting a global workforce’s technology needs.
They initially engaged us to help them create a playbook of standard operating procedures to drive predictability, agility, and efficiency in servicing employee tech needs. But as we helped them imagine the art of the possible, we set our sights higher, ultimately building a strategy for service automation and digital experiences that work in concert with SOPs and designing an MVP solution and a framework to continually build upon their internal product ecosystem to drive efficiency, scale, accuracy, and predictability. This, in turn, will help our client optimize their internal technology asset investments, reduce risk, and improve the quality of service to colleagues.
Enabling data-driven business processes by translating between business needs and infrastructure parameters
CP Skin Health Group, Inc., a division of Colgate-Palmolive focused on product and service innovation for dermatologists, estheticians, and other skin health professionals, found themselves in a position common among our clients. Rapid growth, including the merging and acquisition of well-established and high-performing brands, led to a fractured data ecosystem. They were leveraging multiple disparate data sources and systems across their business units and many of the processes required for their business relied on manual data entry, which negatively impacted their sales and marketing teams’ ability to operate effectively at scale and created a poor customer experience. They needed a partner to work alongside their Global IT team to create a more unified technology and data infrastructure to serve the needs of the business.
We brought business stakeholders together with their Global IT team to map their data environment, identify and document technical limitations and risks in their data inventory, and define problem statements. As a result of our work, the skin health division and the Global IT team were able to align on a shared data strategy and vision that would pave the way for better support for the skin health division’s business needs and lay the foundation for future data analytics capabilities. This allowed the skin health division’s marketing team to operate more effectively and efficiently and optimized sales processes to deliver better customer experiences and business outcomes.
Bringing a new mobile app to life at the speed of light
Working with one of our development partners, we embarked on a journey to redesign and develop a new mobile application for a national broadband communications provider. The new application required some complex features—like account registration and management, bill pay, service appointment scheduling, and more—that also played high-stakes roles for the customers who would ultimately use them. And the timeline for getting it done was tight. But that’s just the kind of ambitious challenge the Tallwave team thrives on.
We mobilized our wildly talented product design team to quickly develop a digital brand UI kit, UX/UI designs for 3 new complex user flows, front-end code acceleration training, and consultation on UX/UI execution, usability, and accessibility in the span of just a few weeks. The team’s work was a shining example of our ability to deliver great mobile app design at the speed of light without sacrificing our commitment to deliver a great CX for consumers.
A power-packed, end-of-year kickoff for a 2024 product strategy
We partnered with a new client, an energy management services, procurement, and energy infrastructure development firm, in December to help them define and package their intellectual capital and expertise into an ongoing and scalable data-as-a-service (DaaS) product. Starting our engagement this late in the year, it would have been easy to assume we’d kick off in January. But with a client who shares our bias toward rapid action, we decided there’s no time like the present to get the ball rolling.
This month, we mobilized our team to head out to the client’s offices in Texas to lead them through a full-day workshop with their senior leadership team to understand the energy ecosystem and value chain and begin to formulate ways to package their unique value to customers. Seizing the moment to begin our work now puts us in a strong position to advance our plans to design, develop, and test the product concept with prospective customers and develop a go-to-market plan that drives immediate adoption upon launch in the new year.
Contributing thought leadership to the industry
The work we did for our clients wasn’t the only way we created value in 2023. Tallwavers showed up as thought leaders, contributing their knowledge and perspectives on hot industry topics like data unification and enablement, conversion rate optimization, and more at industry events and a few of our own. Some standout moments include:
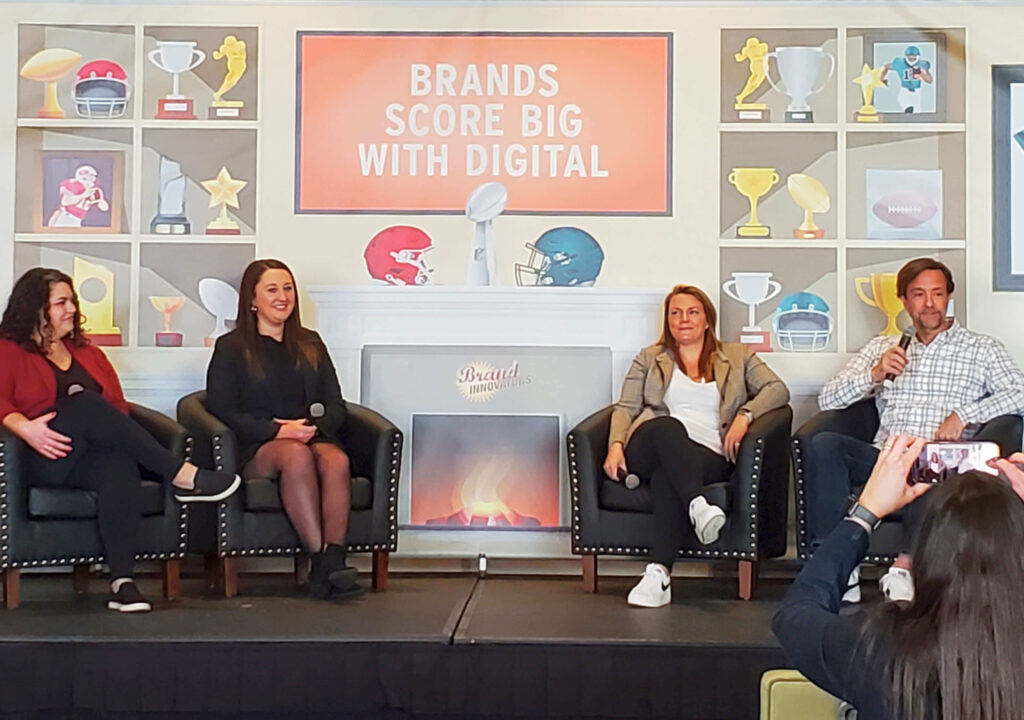
On the physical stage at Brand Innovators
At the Brand Innovators Sports Marketing Upfronts in Scottsdale, Arizona in February, Tallwave Partner, Robert Wallace, had the privilege of moderating a panel session with members of the marketing team from Riddell Sports Group, a leader in high-performance football gear.
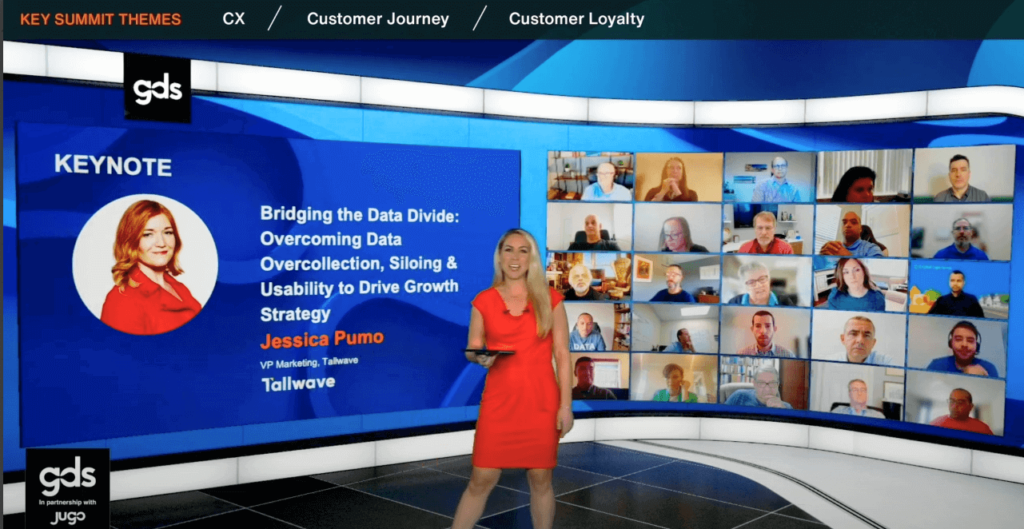
On the virtual stage at the GDS CX Innovation Summit
Our SVP of Marketing, Jessica Pumo, hit the big screen at the GDS CX Innovation Summit in May, presenting a Masterclass Keynote on bridging the data divide. The topic of overcoming fractured data ecosystems to harness the business power of data resonated so much, she gave a special live encore presentation at our invite-only dinner for current and prospective clients focused on data unification and enablement in August.
Spreading the word on the value of CRO
Conversion rate optimization can be an extremely effective strategy for improving conversion rates and maximizing return on investment in traffic-driving marketing. But it requires a highly integrated approach to execute, making it difficult for clients and many other digital agencies to capitalize on. Our Integrated Marketing team brought their knowledge, experience, and expertise to conversion-conscious brands of all kinds in a CRO webinar in May.
Pursuing personal and professional growth
Our ability to do great work for clients and contribute thought leadership to our industry is fueled by our relentless pursuit of growth. In 2023, Tallwavers fed their brains, expanded their knowledge, and refined their perspectives on a wide range of topics through conferences, events, and other personal and professional development opportunities. Here are two that really blew us away:
Making quality connections at KPMG /Michigan Ross QuantumShift
Tallwave CEO, Jeff Pruitt, had the rare opportunity to attend QuantumShift, an exclusive four-day peer-to-peer learning experience for the top decision-makers of fast-growing private companies. This experience took Jeff out of his day-to-day business environment to share with, learn from, and collaborate with leading CEOs from around the country as well as top professors from the University of Michigan’s world-renowned Stephen M. Ross School of Business. It was a highly impactful experience that allowed him to live our value of thoughtful rigor in a whole new way while embracing the power of human connection.
Having flurries of fun at the Snowflake Data Cloud World Tour
Senior Data Strategist, Brooke Weidenbaker, and Engagement Manager, Rikki Ebenal attended the Snowflake Data Cloud World Tour event in Austin, Texas where they plowed through presentations, demos, and customer breakout sessions celebrating data centricity and came away with new ideas and examples to share with clients as we help them navigate the data maturity curve.
Raising a glass to the past and focusing on the future
Reflecting on all we’ve done, everywhere we’ve been, and everything we’ve accomplished, we’re proud of the year we’ve had. And we’ll be raising a glass in gratitude for the opportunities it’s brought us to learn, grow, and evolve and to help others do the same. It’s been a year worthy of celebration. But when the clock strikes midnight on December 31, our gaze will be squarely focused on the future and all the opportunities that lie ahead to help our clients dream bigger about the growth possible for their brands, discover a path to achieve it, and not just do what it takes to get there, but to constantly strive to do better together.
We recently had the privilege of attending the Snowflake Data Cloud World Tour event in Austin, Texas. It was a full day of presentations, demos, and customer breakout sessions dedicated to discussing the technical and cultural challenges that organizations face as they strive to become more data-driven. Industry leaders who have harnessed the power of Snowflake’s data processing technologies and platform experts convened to shed light on the evolving landscape of data utilization and the critical need for businesses to adapt.
In today’s business environment, where access to data has reached unprecedented levels, success hinges not on the sheer volume of data you have access to but on how effectively you can leverage it to make informed decisions on an ongoing basis. In fact, research by Mckinsey & Company found that insight-driven companies report above-market growth and EBITDA (earnings before interest, taxes, depreciation, and amortization) increases of up to 25%.
Our most significant takeaway from the event was the pervasive sense of urgency, coupled with encouragement, that resonated throughout the sessions we attended. In the fast-paced world of business, staying ahead of the curve is imperative. The lifeblood of modern organizations is data, and if your company hasn’t already placed your first-party data at the forefront of your decision-making process, you risk falling behind. While it’s one thing for decision-makers to prioritize data, it’s another to instill a data-centric culture throughout your entire organization.
During the event, we heard from business leaders who recounted their early efforts to get their data houses in order. Some of these efforts date back to 2017 and 2018 when these visionaries recognized the transformative power of data and embarked on a strategic journey. Fast forward, as 2024 approaches, data isn’t merely a choice—it’s a necessity. If your organization hasn’t embraced a data-centric approach yet, the time to dive in is now.
Right after returning from the event, we received a timely report from Experian Research, focusing on the “Data Quality Revolution.” The message was crystal clear: if your business isn’t placing a strong emphasis on access to high-quality data, you should be, and the time to act is now. Continue reading as we explore the key takeaways from both the Snowflake event and the complementary Experian report.
The shift towards data-centricity: Where we stand
In the realm of data-driven decision-making, businesses are no longer tentatively testing the waters; they’re taking a deep dive. As highlighted in the Experian research report, “Over a third of business leaders say that better and faster decisions using data is a top priority to respond to market pressures. A continuous influx of accurate data enables team members—technical or not—to act with confidence. This is a claim that we see year after year and is vital in a market that is moving faster than ever.”
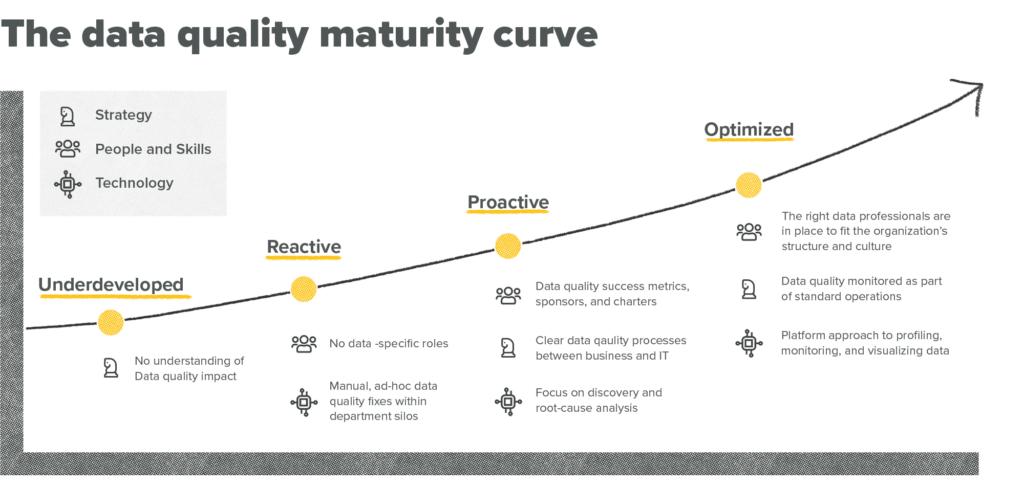
This sentiment echoes the progressive strides made by forward-thinking companies showcased at the Snowflake event. For instance, the Senior Director of Data Architecture, Engineering, and Platforms at a Fortune 500 athletic retailer shared insights into their innovative use of real-time data. By monitoring inventory levels and analyzing optimal pricing strategies in real-time, they’ve effectively maximized space utilization and ensured optimal profitability without compromising margins. This sophisticated approach underscores how organizations at advanced stages of data maturity leverage their data reservoirs to tackle genuine business challenges. Experian defines data maturity as “the extent to which your business can collect valuable data, derive meaning from it, and leverage this information in the decision-making process.”
Successful companies are often able to point to a mature data strategy that is disseminated throughout the organization that lends them a competitive edge. Consider Netflix or Amazon, for example. Both companies utilize their data to personalize content and provide product recommendations that increase customer satisfaction and ultimately drive greater customer engagement, retention, and overall revenue.
However, this level of sophistication isn’t universal. For numerous organizations, the journey along the data maturity curve is just beginning. Bridging the gap between recognizing the potential of data-centricity and effectively implementing it remains a common challenge encountered across various industries.
The challenges: Technical and cultural hurdles
One of the key challenges emphasized at the event was the demand for tools that can expedite the transition to data-centricity without subjecting organizations to extended development timelines. In today’s fast-paced business landscape, waiting months for development to design and implement complex systems is simply not feasible and leads to frustration throughout the organization.
What businesses need are solutions that are agile, efficient, and user-friendly. Experian “[s]urveyed businesses are looking at their technology to plan for scaling, expanding, and innovating data quality initiatives including easy-to-use tools for business users (50%).” The emphasis on user-friendly tools highlights a critical aspect of overcoming technical hurdles—providing accessible platforms that empower business users, regardless of their technical backgrounds, to harness the full potential of data, ensuring that the journey towards data-centricity is smooth and collaborative.
Many organizations now find themselves at a crossroads—they’re acutely aware of the immense potential that a data-centric approach offers, but they are equally familiar with the growing pains that accompany this transformative journey. The heightened awareness of the benefits is juxtaposed with the acknowledgment of the challenges. This duality can be both motivating and overwhelming. The Experian research report echoes this sentiment, revealing a profound truth: “Year after year, we find that data investment equates to business growth. Our study shows that 95% of super performers—these high-achieving and data-mature leaders—believe that data quality is fundamental to business operations going forward.”
This statistic underscores the critical importance of data quality in the contemporary business landscape. It’s not merely a matter of investing in data; it’s about investing in high-quality, accurate data that can fuel informed decision-making and drive business growth. The realization that data quality is intrinsically linked to future success is a powerful motivator for organizations navigating the complexities of the data-centric journey. It signifies a shift in mindset from viewing data as a mere asset to recognizing it as a cornerstone upon which robust business operations are built.
While the challenges are palpable, so are the rewards. Embracing the potential of a data-driven approach means not only understanding the significance of data quality, but also taking proactive steps to address it. As organizations grapple with the intricacies of data utilization, this awareness becomes a guiding light, illuminating the path toward transformative change. By investing in data quality, businesses not only mitigate risks but also position themselves for sustained growth and innovation.
In this landscape of shifting paradigms, Tallwave stands as a strategic partner, ready to navigate the complexities of the data revolution alongside your organization. We offer tailored solutions designed to guide you and your teams to think through what data matters to your organization and build a culture that ensures your business is not just prepared for the future but actively shaping it. Let’s embark on this transformative journey together—where challenges become opportunities and data becomes the cornerstone of your success.
Tallwave: Your partner in the data journey
If your organization is ready to embark on the journey of embracing data-centricity but you’re uncertain about where to start, Tallwave is here to provide expert guidance. We know the intricacies of this transformation, offering expertise in both technical solutions and cultural adaptations across various teams in your organization. Our approach is tailored to your specific needs, ensuring a seamless integration of data-centric practices into your existing framework.
Ready to make the shift?
Don’t wait until you’re left further behind—take action now. Discover the business benefits, navigate the challenges, and transform your data potential into tangible results. Your journey toward a data-centric future starts today. We’re ready to lead the way.
There’s often a substantial divide between business and technology teams. It’s more than mere miscommunication; it’s a foundational misunderstanding of each other’s domains and a lack of shared context for each other’s needs and goals. Imagine architects striving to convey their visions to builders without comprehending the construction process, or builders attempting to decipher architectural blueprints without a sense of the broader design. This disconnect between business and technical realms can lead to frustration, costly errors, and missed opportunities. This is especially true for marketers and developers or technology partners.
There’s a unique power that comes with aligning technical teams with marketers to ensure a seamless and productive collaboration. When these two crucial functions get on the same page, the results can be transformative. Clear communication and a shared context for business goals, needs, and priorities eliminate confusion, accelerate project timelines, and enhance innovation. By bridging the gap between tech and marketing, you unlock the potential for more creative and data-driven strategies, resulting in a competitive edge. In case you don’t happen to have a magical marketing-to-tech translator, here are some tips for achieving shared understanding.
Speaking in Tongues: Bridging the Understanding Gap
There are many reasons communication breakdowns occur between business and technology teams. In many cases, divergent communication styles and thought processes are responsible for misunderstandings, but there’s often more to the story. Here are three common gaps and possible solutions to align teams and come together.
1. Language and Jargon: Standardizing Terminology for Clarity
One thing business and technical teams have in common is they love their jargon and acronyms. Ironically, that’s also the root of many communication breakdowns that occur between them. In many organizations, seemingly straightforward terms can have very different meanings when used in different ways or by different teams. For example, will terms like “lead” or “account” be interpreted the exact same way to your sales, marketing, and engineering teams? Odds are they won’t.
Standardization of terminology: Bridging this language gap requires standardizing terminology across organizational departments where possible, especially for terms that apply to the business as a whole. Ensuring a shared understanding of standard terms within the organization can eliminate a significant hurdle to effective communication and collaboration between business and technical teams.
2. Lack of Context: Fostering Alignment with Business Goals
Miscommunication often springs from a lack of context. This can happen when team members occasionally lose sight of overarching business objectives. But more often, the challenge is that different teams don’t understand one another’s roles in supporting shared business goals and the intersection points between them. This context deficit can lead to misinterpretations and misaligned efforts and expectations, impeding collaboration between business and technical teams.
Clarity in business goals: Shared context begins with a shared understanding of business goals. Whether achieving growth, reducing costs, enhancing customer satisfaction, or another objective entirely, each team needs to have a clear line of sight into business goals. Connecting actions to goals: Besides clarifying the business goals, teams need to understand their roles in supporting them. For example, a developer or technical SEO optimizing website performance may need help to grasp how their work directly impacts customer satisfaction and revenue growth.
Transparent communication: Transparent and consistent communication on progress toward and contributions to business goals can be a potent tool for bridging the context gap. Regularly sharing updates on progress toward goals and highlighting how various teams’ contributions fit into the broader strategy can help drive alignment across groups and foster shared understanding and ownership over goals.
3. Communicative Friction: Creating a Safe Space to Negotiate Meaning
Miscommunication is typically unintentional. Individuals introduce their own mental models, biases, and past experiences into what they say, hear, and interpret. People also tend to prioritize their own perspectives, needs, and priorities without considering the viewpoint of others, often without realizing it. This can lead to misunderstandings, even when the message seems clear. For example, a statement about cost-cutting measures may be perceived positively by one team and negatively by another, depending on their prior experiences.
Fostering a culture of open communication: Encouraging empathy, active listening, and open dialogue can help individuals become more aware of their biases and better understand the perspectives of others. Organizations should strive to create a culture of open communication where employees feel comfortable seeking clarification and providing feedback. This can help prevent misunderstandings from festering and becoming more significant issues foster a more positive work environment, and enhance overall productivity and collaboration.
Come Together / Connect / Bridge the Gap
Understanding the three common challenges outlined above can help you avoid some of the most frequent culprits of the divide between tech and business teams. Here are a few actionable steps you can take across your organization to further bridge the gap, prevent miscommunication, and drive shared understanding.
Set shared and aligned goals
They say what gets measured gets done. If that adage is true, what gets measured collectively gets done collaboratively. In setting goals, ensuring clear connections between individual goals, team/department goals, and company goals can help get disparate teams rowing in the same direction. And when appropriate, establishing shared goals that require collaboration to achieve can incentivize teams to work together toward a common objective.
Establish clear communication protocols
Develop and document communication protocols that outline the preferred methods of communication, frequency of updates, and responsible parties for different types of projects or initiatives. This will help ensure everyone understands the expectations and processes for sharing information.
Implement a project management tool
Invest in a robust project management tool to centralize project-related information, tasks, and progress updates. This tool should be accessible to both technical and business teams, making it easier for everyone to stay informed and track project status.
Cross-train team members
Encourage cross-training between technical and business team members to enhance mutual understanding. When team members understand each other’s roles and responsibilities, they are better equipped to communicate effectively and anticipate each other’s needs.
Foster a culture of transparency
Promote a culture of openness and transparency within your organization. Encourage employees to share information, ask questions, and provide feedback without fear of repercussions. When information flows freely, it reduces the chances of misunderstandings and miscommunications.
Conduct regular feedback sessions
Organize periodic feedback sessions where team members can discuss their experiences and challenges related to communication. Use this feedback to identify areas for improvement and implement necessary changes.
Use visual aids and documentation
Encourage the use of visual aids, diagrams, and well-structured documentation to convey complex technical information more efficiently for non-technical team members.
Monitor and adapt
Regularly assess the effectiveness of your communication strategies and adjust them as needed. Solicit feedback from team members and stakeholders to ensure that the solutions you implement address the specific challenges in your organization.
By implementing these solutions, you can foster better communication and collaboration between technical and business teams, ultimately bridging the gap and reducing the chances of miscommunication that can hinder your organization’s success.
Let a strategic partner facilitate clear communication
Just like a therapist can provide a trained, empathetic ear to overcome discord in personal relationships, enlisting a neutral third party can help break through the silos between business and tech teams to achieve mutual understanding. With a team of experts proficient in technical, marketing, and business strategy, our ability to translate between business stakeholders and technical teams is just as valuable to our clients as the work we do as data, marketing, and business strategists and practitioners.
By partnering with Tallwave, our clients gain more than an intermediary; they acquire a strategic ally capable of fostering collaboration and alignment across cross-functional teams and projects to create real impact for their businesses. Just as architects and builders seamlessly collaborate based on a shared blueprint, Tallwave facilitates the fusion of business and technology worlds, ensuring that your organization’s goals are not just spoken but realized.
The artificial intelligence revolution has rocked our world in a few short months. OpenAI launched ChatGPT. Bing released a chat feature. Google opened access to Bard and the experimental Search Generative Experience. As these new tools emerge, almost everything about how we seek, access, and interact with online information changes. And it begs the question…
Could all these AI-enabled changes mean SEO is dead? The answer is a hard no; it’s just different. The days of optimizing websites exclusively for crawlers and bots are far behind us. We, as SEOs and marketers, must embrace the shift toward optimizing websites, content, and online experiences for humans and their information needs. As such, search engine optimization is alive, and will become even more important in your web strategy as AI tools advance in this new era.
Living in the moment: Understanding SEO, AI, and SGE
SEO, AI, and SGE are three of the most important technologies today, and they’re all becoming inseparably linked. AI is already used in a number of ways to improve SEO, from generating high-quality content to identifying and targeting the right keywords.
As AI develops, it will likely play an even more significant role in SEO, helping businesses reach their target audiences more effectively. By staying ahead of the curve with these technologies and strategies, companies can position themselves for success in the future of search. Before we dive into the details of what comes next for SEO, let’s look at broader definitions and how these technologies and strategies impact each other today.
What is SEO?
SEO (search engine optimization) is nothing new. In fact, both the concept and the term have been part of the web-based world since 1997 — before Google existed. At this time, search engines functioned as directories or virtual yellow pages. And as more consumers adopted the Internet, more businesses became invested in making themselves visible on the Internet.
SEO is a complex and ever-changing field, but it is essential to any online marketing strategy. Your web presence depends on organic SEO. Traditionally, SEO depends on fundamental factors that increase website traffic and search engine placement, which include:
Creating relevant, keyword-optimized content.
Optimizing the website’s title tags, meta descriptions, and header tags.
Building backlinks from high-quality websites.
Ensuring that the website is mobile-friendly.
Improving the website’s loading speed.
What is AI?
AI, short for artificial intelligence, is a technology that mimics or simulates human intelligence. There are a variety of applications for AI, from self-driving cars to automated manufacturing processes. Machine learning, deep learning, and cognitive computing all influence how AI works.
Conversational and generative AI tools like ChatGPT, Bard, and Bing are natural language processing tools and can communicate in a human-like way. They provide information quickly and can generate new text, code, images, and other kinds of creative content.
SGE is still under development, but it’s designed to make searching for information online even more helpful, instructive, and insightful. By nature, SGE hinges on providing users with a more personalized and conversational experience. It is intended to do this by:
Generating concise and informative answers to complex questions.
Providing relevant visual content, such as images, charts, and graphs.
Suggesting follow-up questions to help users explore their topic of interest further.
Translating search results into different languages.
Here are some examples of how SGE can be used:
If you search “how to change a tire,” SGE might generate a step-by-step guide with images and videos.
If you search for “best restaurants in Phoenix,” SGE might generate a list of restaurants with user reviews and links to their menus.
If you search for “what does life even mean?” SGE might generate a summary of different philosophical perspectives on the topic.
SGE is revolutionizing the way we search for information. Using generative AI to produce more personalized and informative results, SGE can help searchers (consumers) find the information they need more quickly and easily.
The current state of SEO: ‘It depends’
We can’t ignore the fact that AI’s emergence and proliferation are rattling to SEO as we traditionally know it.
For many SEO experts, these new and rapidly evolving advances challenge how we think about what it means to optimize for search.
These concerns check out, too. Google’s recent Helpful Content core algorithm update, which began rolling out in August and has extended into September 2023, is making one fact glaringly obvious: SEO no longer means optimizing content and website experiences for search engine crawlers and the only way to win top-ranking spots, boost CTR, gain qualified organic traffic (and lift conversions) is to optimize for the human experience.
While AI, generative tools, and even search algorithms gain a better understanding of what kind of content is helpful and informative to people, the notion of keyword-stuffed web copy created just for search engines is on its way out, and helpful content written by people, for people, has gained momentum as what it takes to win in the competitive SEO space.
Welcome to the future: Embracing content strategy with SEO, SGE, and AI in mind
As more web users turn to AI and SGE tools to do research and make informed decisions, it is increasingly important to be visible to searchers no matter the medium they’re using and aware of how your business is perceived by both artificial and human intelligence in this new virtual realm.
The only way to achieve this goal and prepare for future advancements is to embrace a website content strategy intricately interwoven with forward-focused SEO. This is evident with each Google core algorithm update as they increasingly move toward rewarding sites that relay information in an easy-to-understand, conversational, and unbiased tone.
Next steps for content strategy, SEO and SGE success
It might sound counter-intuitive, but embracing an organic content strategy with a human element is vital to success in today’s AI-driven landscape as SGE emerges. This especially rings true when your business and website tie into YMYL (your money or your life) topics like health, medicine, finance, and current events.
Understand your customers’ journey. Linguistic profiling and search journey analysis can help you define your target audience’s journey. Where are they in their conversion journey? Understanding their needs and offering solutions improves their experience on-site and with your brand.
Write for your target audience. Before you start writing, take some time to think about your target audience. What are their needs and interests? What kind of content would they find helpful? What are the values that drive their decision-making?
Do your research. Make sure that your content is accurate and up-to-date. Cite your sources and link to other relevant content.
Be clear and concise. Get to the point quickly and avoid using jargon.
Write in a conversational tone. Imagine that you’re talking to a friend or colleague.
Break up your text with images, videos, and headings. This will make your content easier to read and scan.
AI is poised to revolutionize SEO, empowering businesses to reach their target audiences with unprecedented precision. Businesses must ethically embrace AI and other innovative technologies and position themselves as leaders in this rapidly evolving field. This requires an online strategy inextricably linked to forward-thinking SEO created by humans for humans.
Offering SEO solutions and website and content strategy is just part of how Tallwave wants to drive your success. As a leader in providing integrated marketing solutions and more to both established and up-and-coming brands, Tallwave is ready to deploy our customer-centric and cohesive approach in a way that is unique to your vision and creates exceptional experiences for consumers of all kinds.
The suspected budding relationship between Taylor Swift and Travis Kelce has become a major media moment. Whether you’re team “ Tayvis” or “Swelce” (or you remain unaffiliated), it’s almost impossible to escape the very real effects this speculated pairing is having on pop culture, whether romance is real or not. But what does this celebrity romance have to do with marketing? Well, hang on to your Eras tour T-shirts, because there’s more to this story than meets the eye.
Let’s explore how the “shipping” of Taylor Swift and Travis Kelce by both music and football fans alike has sparked newfound engagement within the NFL community and the lessons marketers and growth leaders can draw from this phenomenon. …Are you ready for it?
Electric Touch: The high-voltage power of unexpected partnerships
When marketing strategies get a little stale and your standard playbook starts gathering dust, a creative and unexpected partnership can be an effective way to shake it off. This is an approach Swift has deployed herself in collaborations with unlikely artists like Kendrick Lamar in “Bad Blood.” The media attention on Taylor Swift and Travis Kelce’s apparent joining of forces is a great reminder that successful marketing often involves unexpected partnerships and the value of being open to collaboration opportunities outside of our comfort zones.
The media attention on Taylor Swift and Travis Kelce’s apparent joining of forces is a great reminder that successful marketing often involves unexpected partnerships and the value of being open to collaboration opportunities outside of our comfort zones.
While the generated media attention is great for driving cross-audience awareness for Swift’s and Kelce’s respective personal brands, is there a more substantial quantitative impact behind the hype? Absolutely. Consider this: the NFL, a sports giant with massive brand awareness and a highly engaged core audience, is experiencing increased engagement from Taylor Swift fans because of her connection to Travis Kelce. In fact, the Chiefs vs. Bears game where a cheering Swift first caught the attention of viewers and sportscasters was the most watched game of the week with nearly 25 million viewers, including a 63% increase in female viewers aged 18 to 49, according to Roku. This unexpected alliance demonstrates that sometimes, the most fruitful partnerships come when you’re willing to break the ice and think outside the box.
Emotional Connection: How soulful and authentic storytelling hits different
When it comes to authentic storytelling and connecting with people on an emotional level, Taylor Swift could teach a master class. She’s poured her heart and soul into her music, sharing her life’s ups and downs through songs like “Love Story” and “All Too Well.” Her lyrics and melodies tap into the human experience, making listeners feel like she’s singing about their lives and her uncanny ability to connect with her fans on an emotional level has turned them into a community of loyal followers.
In marketing, it’s crucial to tell your brand’s story authentically. Customers connect with brands that share their values and experiences. Marketers can create emotional connections with their audience through storytelling, relatable content, or simply empathizing with their customers’ needs. Finding that end game of emotional engagement can make all the difference, so don’t be afraid to share your journey and be as fearless as Taylor when it comes to opening up to your audience.
Staying Relevant: ‘Tis the damn season for a reinvention
In marketing, adaptability is key. Both Taylor Swift and the NFL have showcased remarkable adaptability in reaching and engaging their expanding fan bases in the face of an ever-evolving digital landscape. From her country beginnings in Tim McGraw to her pop reinvention in 1989 and her indie-folk venture in folklore, one thing Taylor Swift is known for is her ability to adapt and evolve with the times. She’s consistently changed her style, not just to stay relevant to an evolving audience base but to reflect the evolution of her own identity as an artist and brand. She seamlessly transitioned from country to pop, experimenting with indie-folk, and all the while, leveraging digital platforms to release surprise albums and engage directly with her fans on social media. The result has been a resounding and quantifiable success.
For its part, the NFL has recognized and responded to the shifting media consumption habits of younger generations and embraced digital platforms to livestream games, share highlight reels, and interact with fans in real-time on social media. Travis Kelce specifically has showcased a remarkable ability to engage effectively with a digital-native audience, elevating his status as both a sports personality and a brand. Kelce’s active presence on platforms like Instagram, Twitter, and TikTok allows him to share behind-the-scenes glimpses of his life, showcase his unique personality, and connect with fans beyond the football field. And New Heights podcast with brother and Philadelphia Eagles center, Jason Kelce, has become a dynamic platform where the Kelce brothers engage with their fans on various topics, including sports, lifestyle, and personal experiences. By leveraging the podcasting medium, they’ve created a space for candid conversations, special guest appearances, and authentic storytelling, further solidifying their status as relatable sports figures in the eyes of their fans. The podcast serves as a prime example of how athletes can use modern digital channels to connect with their audience on a deeper level and bridged the gap between traditional sports and the digital age, appealing not only to sports enthusiasts but also to a younger, tech-savvy audience.
By adapting to the digital era and staying attuned to their fan bases’ preferences, Taylor Swift, Travis Kelce, and the NFL as a whole have proven that flexibility, digital prowess, and a willingness to reinvent are essential for sustained success in an ever-evolving digital marketing and entertainment landscape. And you must be ready to pivot and reinvent your strategies to keep up and you can’t be afraid to begin again when necessary.
Crossing Boundaries: Challenging the borders of audience and pop culture
Travis Kelce’s fanbase in the NFL is predominantly sports-oriented. Taylor Swift’s is music-focused. It might be easy to assume that those audiences are mutually exclusive, but they’re not. In fact, Tallwave Product Manager, Anna McKee, sits squarely in both camps. “I’ve been a Chiefs fan my entire life, and I’ve been a Taylor Swift fan since her career first launched. I’ve seen 5 Taylor Swift concerts—two at Arrowhead—and have owned Chiefs season tickets for the last 5 years. I’m right at the center of the Taylor and Travis Venn diagram.” Anna was at the fabled Chiefs vs. Bears game and experienced the phenomenon of this pairing firsthand and then had the experience of watching it from afar catching the Chiefs vs. Jets game a week later. “It was wild how clear the effect was between the two games but in totally different ways. Without the benefit of a TV broadcast to provide a birds’ eye view while I was physically at the Chiefs/Bears game, the conversation was about Taylor the entire time. Whether it was a question out loud or a text or a tweet, everyone wanted to know why she was there, who she was with, and whether it was a PR stunt. Regardless of the speculation, the general consensus with the women I was with was that we didn’t care, we were just excited she was there! Watching the Chiefs/Jets game a week later on TV, the broadcast kept cutting to her, which made it even more real and, in some ways, more exciting.”
“I’ve been a Chiefs fan my entire life, and I’ve been a Taylor Swift fan since her career first launched. I’ve seen 5 Taylor Swift concerts—two at Arrowhead—and have owned Chiefs season tickets for the last 5 years. I’m right at the center of the Taylor and Travis Venn diagram.”
Anna McKee, Tallwave product manager
The steep spike in NFL engagement among women suggests that the apparent relationship has bridged these two seemingly disparate communities, creating a fusion of interests. And Anna’s experience and those like her who are long-time fans of both found another reason to engage more deeply. If there’s one lesson here for marketers, it’s the power of tapping into multiple affinities where possible.
Staying Social: Be a trendsetter, a star
The sudden surge of engagement within the NFL community due to Taylor Swift’s involvement demonstrates the importance of monitoring and staying on top of trends, particularly when it comes to social media. And on that front, Taylor Swift is a force of nature. For example, when it comes to social following on Instagram, Swift’s following outpaces the NFL’s by an order of magnitude. She’s got 273 million, over 9 times the NFL’s 28 million. And Swift’s social power is translating to real gains for both the NFL and Travis Kelce.
While the NFL is still trying to find its footing on how to maximize its return on the Swift halo effect (posting references to Swift’s presence at the game and then subsequently removing them after receiving some backlash), there’s no question they’ve benefitted. As just one example, with the boon of content focused on Swift and Kelce as a pair, the NFL has seen record views on TikTok content. That halo effect has extended to Travis Kelce, too, helping him pick up 380k new Instagram followers and boosting his podcast into the top spot on Apple’s charts.
The surface lesson for marketers here is straightforward: an active and engaging social media presence on platforms like Twitter, Instagram, and TikTok can help you connect with your audience, share your story, and foster a sense of community. This is particularly beneficial for driving engagement with your audience outside of high-intent moments, which can add up to real value over time as it helps cement your brand in the minds of your audience. But there’s a deeper takeaway about the art of timing. As the saying goes, “timing is everything,” and the Taylor Swift-Travis Kelce relationship proves this point. Their romance coincided with the NFL season and Swift’s record-breaking Eras tour, leading to a perfect storm of increased engagement. This isn’t the kind of thing that’s easy to anticipate, but marketers recognize the brand-building value of this kind of rare serendipitous moment. The NFL did, too. While every move they’ve made to capitalize on that moment hasn’t necessarily been pitch perfect, they didn’t let perfect execution be the enemy of perfect timing, which is a valuable lesson in itself.
End Game: Summing up
In the ever-evolving marketing world, we can learn valuable lessons from unexpected sources, just like the budding relationship between Taylor Swift and Travis Kelce. Embrace unexpected partnerships, tell your brand’s story authentically, and leverage emotional connections to engage your audience, including in more casual interactions with your brand. Adaptability, engaging diverse audiences, and capitalizing on pop culture can open new doors for growth. And to complete your mastermind marketing strategy, don’t forget the role of social media, monitoring trends, and be ready to seize those rare and powerful serendipitous moments to propel your marketing efforts forward.
Whether you’re ready to see sparks fly between Taylor and Travis or you’ve got bad blood with this attention-grabbing romance, there’s something to be learned from this pop culture phenomenon. Let’s take these lessons to heart, just as we would with our favorite Taylor Swift songs, and create marketing strategies that create a lasting love affair with our audience.
Data quality plays a crucial role in the business landscape when it comes to informing strategy and enabling growth. As organizations strive to do more (or at least the same) with less, mastering data quality management is imperative. Collecting and analyzing the right data points can help you retain customers, enhance customer experiences, optimize campaigns, boost acquisition, and achieve sustainable growth even as the economy shifts.
But in today’s data-driven environment with evolving tracking technology, compliance demands, and AI disrupting the status quo, problems with data quality and quantity problems are amplified. And these issues come with a steep price: misinterpreted insights, wasted resources, and even concerns with ethics, transparency, and consumer privacy.
Effective data quality management is complex, but it doesn’t have to be. Understanding the causes and consequences of poor data quality, finding a source of truth, building a data-driven culture, and working with the right data enablement partner all come together to empower informed decisions that lead to outstanding experiences.
Missed opportunities: Causes and consequences of poor data quality
Once upon a time, CMOs and growth leaders spent their days thinking about brand strategy with creative license and assumed success came from stellar messaging. But today, these roles hinge on emerging technology, marketing agility, and driving ROI while expecting immediate results — all of which depend on quality data.
Statistics reported in the 2023 Braze Customer Engagement Review indicate that more than one-third of marketing leaders cite the collection, integration, management, and accessibility of data as their top challenges when it comes to customer engagement.
These data challenges come in many different forms. Here are a few common problems in marketing data quality management:
More data, more problems
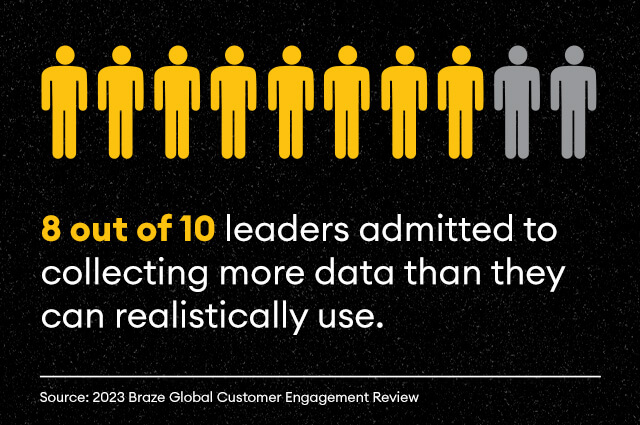
Organizations often find themselves drowning in a sea of information in the era of big data. According to the Braze survey mentioned above, a staggering eight out of every ten leaders surveyed admitted to collecting more data than they can realistically use.
Data down the drain
With so much data at hand, so much goes to waste. Experian’s most recent data experience research report stated that an estimated 73% of all collected marketing data goes unused. Overcollected and underutilized data can come with high costs, ranging from consumer privacy risks to wasted resources.
A lack of standardization and guidelines in your data strategy leads to all kinds of complications. Inconsistencies across systems and departments create confusion, and inaccurate data can mislead decision-making processes. Incomplete data leads to gaps in insights, while outdated data fails to reflect the current reality. This results in unreliable data and an inability to inform strategy.
Disparate times, disparate measures
Fragmented data is a major challenge for many (if not all) organizations. According to a study conducted by Wakefield Research, 441 of the 450 senior data leaders surveyed indicated that data silos exist within their organization. In addition, 311 of the same leaders report they have “trapped” data they cannot access. Rescuing trapped data can open opportunities for actionable insights.
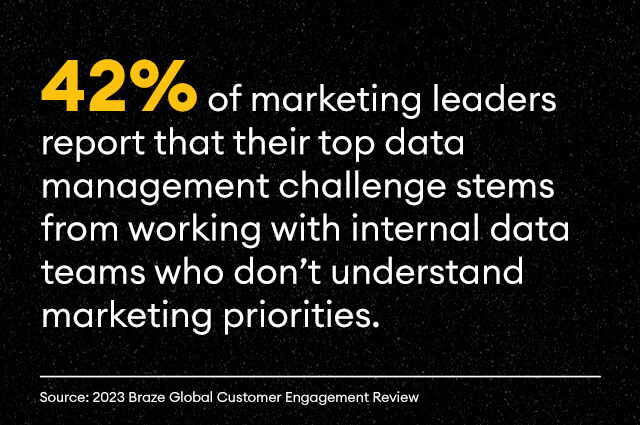
What causes all the data debacles? It could be that marketing people and data people don’t always speak the same language. Braze found that 42% of respondents reported that their top data management challenge stems from working with internal data scientists and IT departments who don’t understand marketing priorities. The second biggest challenge is that marketing talent lacks data skills.
Data mismanagement comes with consequences that can be summarized in two words: missed opportunities. Without a data-driven strategy, you’ll likely end up with wasted resources and miss out on what matters: customer retention, acquisition, and growth.
Seizing opportunities: 4 considerations for collecting quality data
Access to high-quality data enables business leaders to better understand their customers: their needs, preferences, expectations, and buying habits. This understanding helps companies successfully satisfy and engage customers, increase brand awareness, and drive sales conversions.
While ongoing data quality management might feel like an uphill battle, there are a few best practices you can implement to harness the power of accessible analytics.
Here are four actionable steps to consider:
Align data collection with business goals: Start by aligning your data collection efforts with your organization’s goals and objectives. By focusing on the data that truly matters, you can avoid the trap of over-collection and instead gather the insights necessary to drive meaningful actions.
Standardize data across systems and departments: Establishing data standardization protocols is vital to ensure consistency and accuracy. Implementing standardized data models, formats, and definitions across systems and departments fosters a unified view of the data and enhances its reliability.
Implement data validation and verification processes: Introduce robust data validation and verification processes to maintain data integrity. These processes involve checking for completeness, identifying and resolving inconsistencies, and ensuring data accuracy through various validation techniques.
Invest in data cleansing, enrichment, and visualization tools: Leverage data cleansing and enrichment tools to improve the quality of your data. These tools can help identify and rectify errors, fill in missing information, and enhance the overall value of your data. Additionally, data visualization tools and dashboards give stakeholders the context they need to gain actionable insights from complex data sets.
Data-driven culture: Collaboration and metrics that matter
To truly master data quality management, organizations need to foster a data-driven culture. This kind of environment empowers leaders to put facts before instincts and take valuable action with each decision.
Unified team, unified data strategy
A data-driven culture is fueled by connection. The symbiotic relationship between data scientists and marketing specialists enables realizing your analytics tools’ full potential, allowing your organization to make data-driven decisions and achieve greater results. When marketing teams and data teams combine forces and truly understand each other, priorities are aligned.
Prioritizing data quality lets you unlock valuable insights, reach your target audience more effectively, and ultimately enhance customer experiences while maximizing the return on your marketing investment.
The first step in creating a culture defined by data is finding a data strategy and analytics partner who truly understands the metrics that matter. A true enablement partner, like Tallwave, can help you narrow down the most relevant data points to avoid overcollection and support unification. You’ll have access to meaningful insights that drive positive outcomes.
Ready to embrace data enablement? Let’s chat. We can work together to create a unified data strategy that gives you the information needed to implement outstanding experiences. Reach out to Tallwave now.
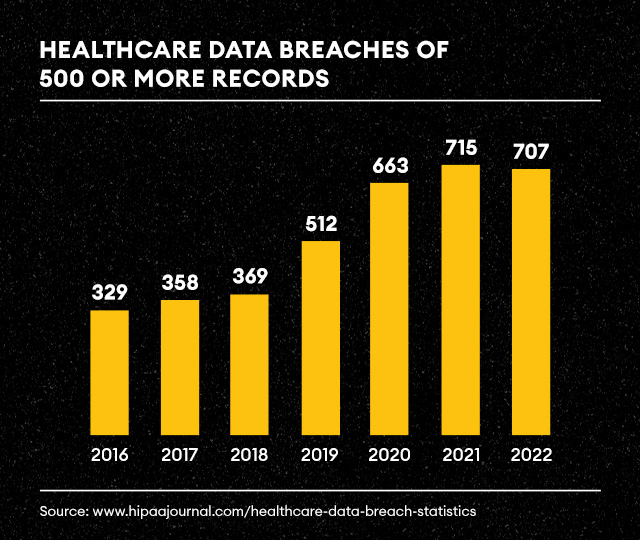
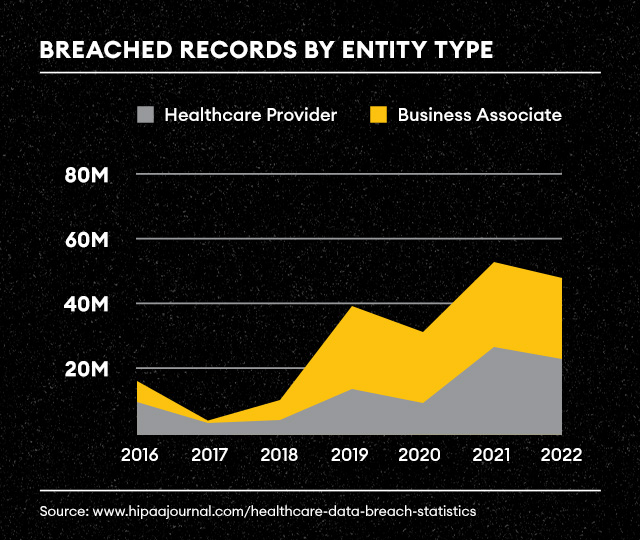
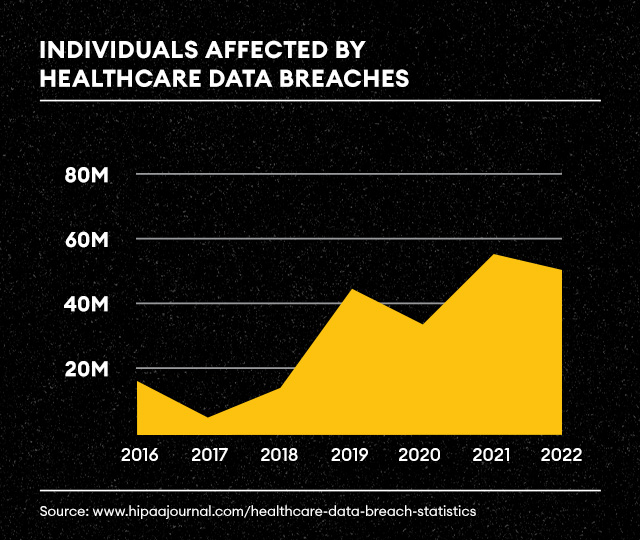
On December 1, 2022, the U.S. Department of Health and Human Services’ (HHS) Office of Civil Rights (OCR) issued a bulletin stating that the use of third-party cookies, pixels, and other tracking technology by healthcare companies may be violating the Health Insurance Portability and Accountability Act (HIPAA). This is in the wake of a year of unprecedented data breaches involving business associates, or third-party vendors, throughout the healthcare industry.
2022 saw over 700 healthcare data breaches impacting more than 50 million individuals. And nearly a third of the ten most significant breaches were due to third-party tracking pixels from companies like Google and Meta (Facebook). While Google and Meta help companies understand their website and other owned properties’ usage, users of the platform have inadvertently also exposed data ranging from personally identifiable information such as Social Security numbers, driver’s license numbers, and financial account information to medical record numbers, insurance account numbers, and more.
Such breaches come with hefty financial penalties, including fines, settlements, and other repercussions for the entities involved. But a more significant impact is felt by the consumer whose data has been compromised, as stolen personal information can result in identity theft. And recovery from identity theft is often a long and burdensome process.
Up until last December when HHS issued its bulletin, it had not provided formal guidelines regarding sensitive healthcare data and HIPAA relative to online tracking technologies. So what does this announcement mean and how can healthcare organizations stay HIPAA compliant?
What do the HHS changes mean for healthcare organizations?
A good starting point is an understanding of the technologies involved and the risks they pose. The HHS announcement specifically speaks to tracking technologies, often third-party, which are generally anonymized. Tracking cookies, specifically pixels, are tiny bits of embedded code used to track a site visitor’s online activity. The data collected from the pixels provides insights that allow the site owner to develop marketing strategies, such as on-site personalized experiences and off-site retargeting campaigns, specific to each site visitor’s behaviors and interactions.
The problem? Many healthcare organizations are using third-party pixels to gain a better understanding of how they can optimize the digital experiences within their public-facing websites and patient portals. And these pixels may be sharing protected health information (PHI) inadvertently with third parties. Most often, the concern lies with pixels on the patient portal, a secure website or application where patients can access and interact with their health data. But PHI can also be collected from the public website and mobile apps in the form of cookies, web beacons, fingerprinting scripts, and other scripts.
So what constitutes PHI?
Protected health information is any information related to an individual’s past, present, or future health, healthcare, or payment for healthcare. This includes, but is not limited to:
Medical records, be they physical, electronic, or spoken
Information pertaining to billing, insurance, or of any financial aspect of an individual’s health or healthcare
Demographic information
Mental health conditions
Tests and laboratory results
All information related to an individual’s diagnosis, treatment, or prognosis
Anonymous session user ID
As of December 1, 2022, anonymous session user ID is considered PHI.
Anonymous user identification allows the website to anonymously identify unique site visitors without the user having to log in or consent to a tracking cookie. Anonymous sessions are captured and aggregated and can include data such as (but not limited to) the user’s IP address, geographic location, language, device, and mobile carrier, but is generally, as the name suggests, anonymous. However, HHS has deemed that these data points connect the individual to the entity and therefore can be related to the individual’s past, present, or future health, healthcare, or payment for healthcare.
The addition of anonymous session user ID considered as PHI now adds additional complexity to an already confusing data security landscape. Furthermore, in order to protect themselves and their patients, the onus is on healthcare providers to ensure they and their partners are not improperly using tracking technology on the healthcare provider’s digital properties, mobile apps, etc.
How can healthcare organizations keep web analytics HIPAA compliant?
As there is no easy website or mobile app consent solution, it is best to develop a compliant strategy that will protect both the healthcare organization and its consumers. Developing a compliant strategy requires engaging all departments (marketing, marketing analytics, legal, IT, etc.) and ensuring organizational alignment around it. This starts with examining your current analytics tech stack to determine if it meets both the organization’s needs and HHS requirements.
Is Google Analytics HIPAA compliant?
Over 28 million websites worldwide currently use Google Analytics, over four million of which are in the United States. Of all U.S. industries that use Google Analytics, hospital and healthcare companies are the third most prevalent. Google Analytics isn’t the only option for tracking website data, but it has the largest market share, and for good reason. It is robust and intuitive. But Google Analytics has also faced challenges, having been banned in a few European countries due to General Data Protection Regulations (GDPR) violations. Google did take steps toward addressing the European Union’s GDPR requirements with its recent release of GA4.
So, does Google Analytics meet the new requirements outlined in the HHS bulletin? The simple answer is no. In basic and 360 configurations, GA3 and GA4 no longer meet the HHS compliance requirements. This is primarily due to specific attributes of the data sets, specifically the session and user ID dimensions.
As a result, healthcare companies are expediting their searches for alternative platforms that will provide organizations with the information they need to measure their digital customer experiences and — more importantly — store that data securely.
What are the best next steps toward achieving compliance?
The first step is to identify and outline requirements for a cohesive transition to a new, compliant platform. The most important of these requirements is a HIPAA-compliant analytics platform provider, one that will be covered under a Business Associates Agreement (BAA). The good news is there are a handful of platforms available that fit this important need.
Additionally, all businesses are unique and have priorities that must be considered when planning a transition to a new analytics platform. Some examples of priorities might include ease of implementation, tag management capabilities, user limits, integrations with other Google products, and interface complexity, among other things.
Once requirements have been prioritized across internal teams, analytics owners will be able to guide a best-fit decision.
Whether your organization has been using Universal Analytics for years or you have recently migrated to GA4, Tallwave can help you organize around your requirements, gain internal alignment, and provide expertise on next best options all the way through the implementation and reporting transition. Reach out when you’re ready to learn more.