Categories
Customer Engagement Uncategorized

9 Metrics That Help Measure Customer Engagement

Gaining new customers is only half the battle when it comes to sustaining a healthy business — keeping customers engaged and loyal to your company long-term is just as important. Sometimes, that’s easier said than done, especially considering the changing nature of customer preferences.


Most companies are challenged with constantly iterating their customer engagement strategies. Oftentimes larger enterprise companies bear more of that brunt in order to maintain market share as more agile upstarts join the scene.


Also read: Data Driven Insights Into the Evolving Customer Experience 


Case and point: A large entertainment and communications firm – despite having experience that predates the internet – came to us with plummeting retention rates. Identifying the cause of their customer churn was essential to strategizing and implementing an improved experience for the future. By conducting research to understand the end-to-end customer journey, we were able to uncover and map out internal and external stakeholder perspectives at each stage. Using that information, we identified which stages in the journey had the greatest impact on customer loyalty. Then we were able to create a prioritized list of suggested improvements to enhance the customer experience and drive a greater bond between the business and their audience.


It’s this kind of work that can make the world of difference when it comes to increasing customer engagement.


Reducing friction and inspiring trust are the cornerstones of customer engagement today. A recent Salesforce study found that 95% of consumers said trust makes them more likely to remain loyal while 80% said the customer experience is just as important as the product or service.


Reviewing the journeys your customers take helps to identify ways to increase convenience and drive engagement, which is essential for success. Here are some top methods to measure customer engagement.

Reducing friction and inspiring trust are the cornerstones of customer engagement today.

Top Customer Engagement Metrics

There are a variety of metrics you can use to create a full picture of your customer experience and increase customer engagement. Here are some of the most frequently used methods::

1. Net Promoter Score (NPS)

NPS is the leading metric for measuring customer satisfaction and loyalty. This is accomplished by asking customers one, simple question to rate the likelihood that they would recommend a company, product or service to a friend or colleague. The rating is on a scale of 0 -10, with zero being “not at all likely” and 10 being “extremely likely.”


How to calculate: Respondents are divided into three groups based on their score.


  • Promoters: (rated 9-10) are loyal customers who will also refer others to your company.
  • Passives: (rated 7-8) are satisfied, but not enthusiastic.
  • Detractors: (rated 0-6) are unhappy customers and could potentially damage your brand by spreading negative reviews.

To calculate your NPS score, subtract the percent of Detractors from the percent of Promoters. Here’s what the formula looks like: % Promoters – % Detractors = NPS. Your NPS can range anywhere from -100 to 100 depending on your ratio of promoters to detractors.

% Promoters - % Detractors = NPS

How it infers customer engagement: Your NPS score is a good measure of your customers’ overall perception of your brand. Customers who fit the Detractor category are unhappy, these are the customers most likely to speak poorly about your brand to others or leave negative reviews. Customers who fit the profile of Passives are not excited about your business and are unlikely to be loyal if a competitor comes along with a sweeter offer. Customers who are considered Promoters are not only loyal, but will act as ambassadors for your company. It’s best to compare your NPS to others in your industry and also to your past scores to monitor any changes in your customers’ perceptions.


Also read: The What, Why, & How Of Customer Behavior Analysis


Best for: This classic customer engagement tool is best for gaining a high-level understanding of customer experience and how loyal your customers are.

2. Customer Satisfaction (CSAT)

CSAT is short for Customer Satisfaction Score. It is a popular metric to gauge customer satisfaction levels for a specific product/service or action you took rather than an ongoing customer relationship.. A CSAT score is expressed as a percentage (100% to 0%). Using the results from a customer surveys that ask respondents to “Rate their overall satisfaction with the goods/services they received. Respondents use the following 1-5 scale:


1 = Very Dissatisfied (or Very Bad)

2 = Somewhat dissatisfied (Poor)

3 = Neither satisfied nor dissatisfied (Neutral)

4 = Somewhat satisfied (Good)

5 = Very Satisfied (Excellent)


How to calculate: To understand your CSAT, you’ll want to divide the number of satisfied customers (represented by those who responded with a 4 or 5 ) by the total number of customers.


Use this formula to calculate: Number of satisfied customers (4 and 5) / Number of survey responses) x 100 = % of satisfied customers

Number of satisfied customers (4 and 5) / Number of survey responses) x 100 = % of satisfied customers

How it infers customer engagement: Your CSAT score is helpful to measure customer satisfaction after an experience or touchpoint with your business. It’s not typically used to represent customer engagement over time, since it’s a snapshot of how each individual customer was feeling during the exact circumstances of the survey.


Best for: CSATs are typically easier to collect than other data points because you’re not asking a lot of your customers. CSATs are also easily understood across many channels of your organization. This makes them ideal for creating company-wide benchmarks that you can update consistently.

3. Customer Lifetime Value

Your customer lifetime value indicates how much your company can expect to earn across an entire relationship with a customer from start to finish. Segmenting your customers by lifetime value can help your company get strategic about the most important groups to engage for long term revenue growth.


How to calculate: Before you can calculate the customer lifetime value, you need to know the average customer value. You do this by determining the average purchase value and then multiplying that by the average number of purchases. That first formula looks like this: Average Purchase X Average Number of Purchase = Customer Value.

Average Purchase X Average Number of Purchase = Customer Value

Then, put that number into the following formula: Customer Lifetime Value = Customer Value X Average Customer Lifespan.

Customer Value X Average Customer Lifespan = Lifetime Value

How it infers customer engagement: It goes without saying that the happier your customers are with your product or service, the more likely they are to continue purchasing renewals or upgrades. Focusing on improving your customer lifetime value typically means you’ll surround customers with support and incentives, which can also lead to higher customer engagement scores. Best for: Compare your customer lifetime value to the cost of acquiring new customers so you can understand if your value realization is strong enough to offset the marketing or sales costs associated with generating demand.

4. User Activity

User activity measures how many unique customers are interacting with your product or service in a specific time frame — typically daily or monthly. This is an ideal customer engagement metric for SaaS companies or apps.


How to calculate: Calculating daily user activity hinges on accurately defining what you’ll consider a user and an activity. To get a strong sense of how users are interacting on your platform, you might want to count actions such as pulling reports or collaborating with team members instead of merely sign ons or app opens.


How it infers customer engagement: By measuring activities that would only happen if the user was engaged — like creating reports, for example — you can begin to understand how often your users are incorporating your features into their lives. If you notice some features are under-utilized, this could be a warning sign that your customers aren’t fully engaging with the potential of your offerings.


Best for: This metric is best for understanding what features of your product are most engaging for customers, so you can continue to iterate on these and improve your value realization opportunities.


Also read: How to Holistically Map the Customer Experience

5. Visit Frequency

Measuring the visit frequency shows you how often the same customer returns to your site or store location. This helps you to understand how familiar your customers are with your brand and the extent to which they are actively seeking your company.


How to calculate: Using Google Analytics, you can pull a count-of-session report to understand visit frequency to your website. Measuring visit frequency for brick-and-mortar locations has historically been more difficult, but new technology, such as Ripple Metrics, can actually measure return frequency in addition to other actions your customers take in store.


How it infers customer engagement: If you have many of the same customers returning over time, this shows a higher level of engagement. However, if you have customers visiting your site or location once and not returning, this shows you have more work to do in order to foster customer loyalty.


Best for: Visit frequency can be seasonal. For example, if you work at an oil change garage, you might only expect customers to return once every six months. That’s why measuring visit frequency is a good metric for companies that understand what the patterns of a happy customer look like. Gain clarity on the big picture of your customer journey so your visit frequency inferences will be valuable.


6. Screentime

Measuring how long a customer spends on your site can tell you how valuable your content is and the extent to which you are helping to make the lives of your customers easier. If your customers spend a long time reading an article or watching a video, congratulations, that means you gave them something to stick around for.


How to calculate: Using your website analysis tools, you can pull a report to specify the total time on site or get specific to understand how long customers are spending on each page.


How it infers customer engagement: If you notice customers are routinely spending a few seconds on each page, that could be a sign that your website content is not engaging. Typically the first action users take when they realize a webpage doesn’t have the information they need is to close it and move on to the next one. This metric can help you determine what content is hitting home with your customers and what needs more work.


Best for: This metric is essential if you rely on content marketing to drive sales or improve the customer experience.

Understanding your customer engagement isn’t always a matter of gathering the most information, but of understanding which metrics to focus on.

7. Pages per Session

Pages per session shows you the average number of pages a visitor to your website reads before they leave your website. Similar to screentime, this metric can show you the extent to which visitors are enjoying your website and gaining value from it.


How to calculate: You can determine the pages per session by dividing the total page views by the total amount of sessions for any given time period. If you use Google Analytics, this number should automatically be pulled for you through the program’s standard reporting in the acquisition overview section. To get more detailed, remember to segment by source. You might find that visitors coming from one channel are more heavily engaged, which could influence how you spend advertising dollars.


How it infers customer engagement: If you have a high number of pages per session it’s likely visitors to your site are finding a lot of useful information and that you are providing a quality user experience. If you find this metric drops over time, it could signal that you need to revisit your content or maintain your website.


Best for: Use this metric to understand how well your website is performing when it comes to serving your customers.


8. Churn Rate

Your churn rate measures the number of customers who are concluding their relationship with your business over a set period of time. For example, if you are a service with subscribers your monthly churn rate would show the percentage of users who have cancelled their subscription each month.


How to calculate: Calculating your churn rate is simple, just divide the number of customers who have stopped doing business with you by the total number of customers. For example, if you have 20,000 subscribers and 1,000 cancelled last month, you would have a churn rate of 5% for the month.


How it infers customer engagement: If you have a high churn rate you can infer that somewhere along the line your customers are becoming disappointed. You’ll need to do some work to understand where in the journey they are seeing less value so you can improve these pain points and extend the customer lifespan.


Best for: This is a good metric for softwares or subscription services that rely on monthly recurring revenue.

9. Social Media Engagement

Your social media engagement can show you how interested your customers are in hearing from you and sharing about the work you do. A high social media engagement rate doesn’t always equate to increased sales, but it can definitely help guide your team to know if you’re on the right track in developing rapport, loyalty and strong word-of-mouth.


How to calculate: To get a high-level view of your social media engagement, measure your average engagement rate by adding the total number of engagements on a given post (this includes likes, comments and shares) by your total number of followers.


How it infers customer engagement: If your social media engagement numbers are low, this could be a sign that you need to do more work providing daily value to your current customers to turn them into brand evangelists. Not all companies rely on social media though, so if your social engagement numbers are low but you have another channel that does well, such as a newsletter, you might want to weigh both sets of metrics against each other before taking action.


Best for: Social media engagement can help companies understand how well they are doing when it comes to creating brand awareness and enthusiasm.

Bottom Line

Understanding your customer engagement isn’t always a matter of gathering the most information, but of understanding which metrics to focus on. Every brand should choose a handful of metrics that matter most to their business operations. Depending on your goals, there are only a few metrics that should be tracked regularly to gauge engagement, loyalty, value realization and growth. For the client we mentioned at the start of this article, we were trying to solve for high customer churn. We decided to narrow available data down so we were only focusing on mapping customer satisfaction. We felt this metric could most accurately predict churn. By understanding where in the journey customers were least satisfied, we were able to identify where drop off occurred.


Curious how the evolving customer experience is changing customer sentiment? Check out our recent research report, or contact us today.

Categories
Strategy

How to Holistically Map Your Customer Experience

But what is a customer experience map?


It’s a visual timeline that illustrates and examines a customer’s entire experiences with a brand, identifying every behavior, interaction, and touchpoint across a variety of channels. Unlike a customer journey map – which only outlines touch points involved from exposure to sale (and sometimes post-sale) – customer experience (CX) maps dive deeper, evaluating omnichannel experiences and internal processes and workflows to illuminate who and what customers interact with, pain points that arise, and moments of truth that are ripe for innovation and improvement.

Overview of the Customer Experience:

  • Start with the customer perspective. Utilize a mix of qualitative and quantitative data (methods below) to map key touch points
  • Map the internal stakeholder journey, including people, processes, systems, via a service blueprint
  • Combine the maps to begin comparing and contrasting the data and employee expectations versus consumer feedback
  • Identify gaps and opportunities, assess impact of innovation and prioritize for the future

While collecting customer feedback through both qualitative and quantitative (also known as moderated and observational) techniques is key (think web analytics, customer surveys, customer marketing data, customer recordings and interviews, industry research, etc.), it’s also equally important to map your internal stakeholder’s (aka, employee’s) journey, detailing moments they believe to be most important in an end user’s experience (this is often referred to as service blueprinting).


Once both maps are completed, they can be compared and contrasted to uncover discrepancies in the customer and internal experience. Pinpointing moments of friction illuminates root causes of customer experience breakdowns that create incredible drag on company retention and growth. Only by taking this holistic approach can you truly start to cultivate next-level strategies for improved customer experiences.

How to Create a Customer Experience Map

As you venture into making your own customer experience map, here are some things to watch out for:


  1. Don’t get stuck in the surface. Make sure that you’re driving to the core and really trying to identify the root cause of experience friction points or issues.
  2. Ensure you take an interdisciplinary approach. It’s important not to be siloed in this thinking.
  3. Don’t just take qualitative notes. When interacting with customers, take a multi-faceted approach. You want to ultimately be able to map your qualitative data with quantitative data. Incomplete data can lead to poor decision-making.
  4. Don’t get too bogged down in the details. Come up for air and focus on the biggest areas of opportunities for improvement. It’s all about prioritization. Lots of companies try to solve or map everything, when in reality – sure, you need to challenge your data and ensure you have a complete view – but you also have to prioritize as you go. It’s a delicate balance to strike.


How to Map the Customer Journey | Tallwave

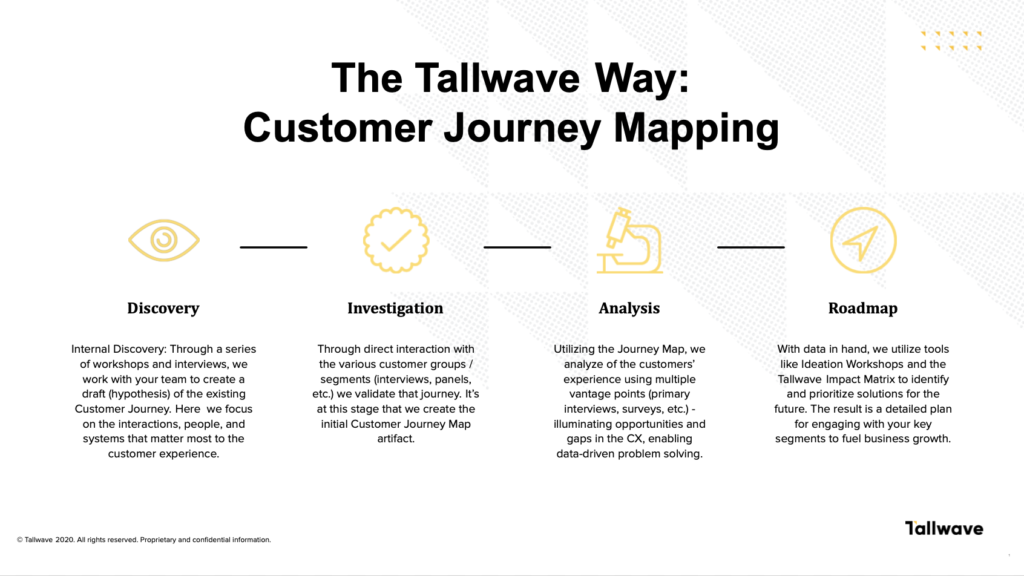
To get started, you must first acknowledge that every touch point is interconnected and feeds into a customer’s perspective and sentiment towards your brand as a whole. The exercise must be authentic. Your goal is to understand your brand’s latent needs and to uncover opportunities that exist due to changing market dynamics, customer expectations and technology breakthroughs.


Then, you must allocate one person or team to see the exercise through to completion. Typically speaking, customer experience mapping should be co-created with an external party. Research done solely in-house can be blanketed by unconscious bias, thus muddling results and growth opportunities. Plus, it’s important stakeholders surveyed throughout feel comfortable expressing their true and honest opinions in a confidential and removed setting.


Once that’s done, it’s time to get to work.

Step 1: Define your goals, scope, and personas

Your team must first align on goals. Conduct a half-day session with the key internal stakeholders across a number of teams to define business and user goals and pinpoint what you want to learn, what you’re hoping to uncover, where you want to drive focus, and how you plan to quantify and validate insights uncovered.


Then, define the personas you want to explore with during the experience mapping exercise. Many businesses have numerous consumer groups. While you can (and eventually should) map the experience and expectations of all of them, you’ll want to identify who they are first. Key details like age, marital status, occupation, daily activities, needs, wants, hobbies, internet behaviors, social media interactions, etc. are all a great starting place. Remember the 80/20 rule and prioritize which groups you’re going to start with. These are your primary personas.


Now that you have them identified, you’ll want to start the mapping exercise by capturing existing hypotheses about your customers and their experience. Be sure to capture their needs and emotions felt throughout all of their experiences with your brand. Some key questions to remember here:


  • What is driving their buying behavior? Why are they interacting with your business?
  • Where do they interact with your brand (before and after purchase)?
  • How many steps do they go through to purchase?
  • How do they feel as they decide to purchase? Is there a touchpoint after they purchase?
  • How do they interact with your brand after they’re a customer? etc.

Next, decide which part of your experience you want to map. In an ideal world, you’d map the entire experience over the tenure of a customer’s relationship with your brand, but that’s likely not doable in your first few sessions. To get started, break experience mapping into segments. Do you want to map the onboarding or registration process? The purchasing journey? Gauge the interactions your brand has with customers once they’ve already bought in? .


Also read: Understanding the Buyer’s Journey to Drive Targeted Campaigns

If you’re stuck – simply try to pinpoint where you think there is the most pain, friction, or confusion in your customer journey. Whether it’s the first, tenth or fiftieth exchange, one bad experience can greatly increase risk of customer churn. A customer who is dissatisfied with an experience will tell between 9-15 people about it* (and that number increases quickly if they take their negative review to social platforms!).

Step two: Evaluate from within

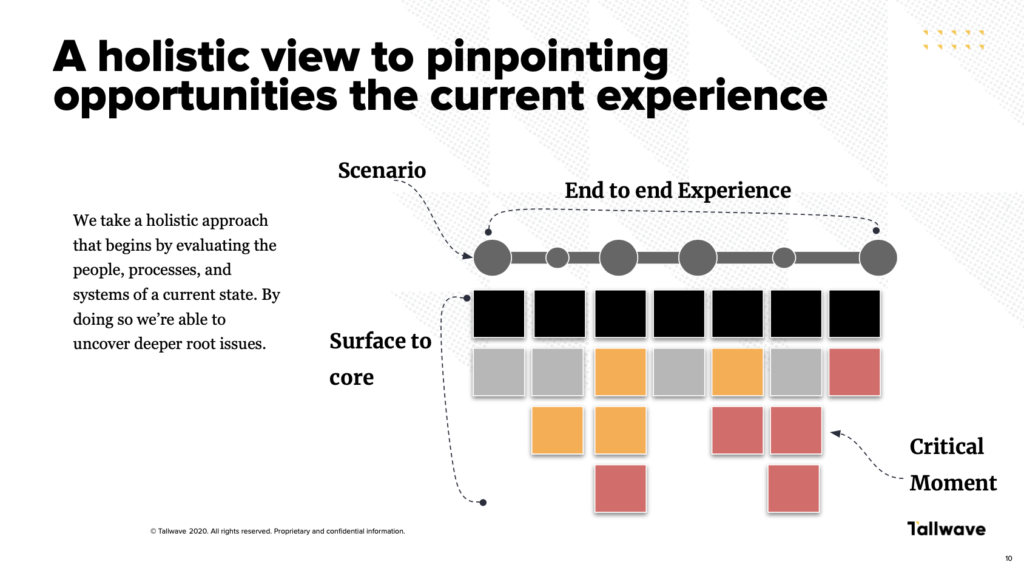
Holistically mapping out your current end-to-end customer experience requires that you evaluate every touchpoint from the surface to the core. That means, you must first evaluate your own people, processes, and systems that impact and touch the customer experience in any way (many organizations refer to this as service blueprinting).


Holistic view of customer journey experience | Tallwave

By doing this, you can uncover deep rooted issues or discrepancies between what internal stakeholders and external customers deem important. This is a critical step in effecting meaningful change to your customer experience. But be mindful to avoid these common pitfalls as you execute:


  • Getting bogged down in the internal perspective: Make sure all focus efforts are on pain point identification as it relates to the customer or your ability to deliver to the customer. This isn’t an exercise solely dedicated to internal frustrations – if you’re wanting to improve the employee experience, that’s a true service blueprinting exercise. For holistic customer experience mapping, you want to make sure your focus is on pain points that have a line of sight to your end users.
  • Settling for the surface answers: Push to go beyond and really discover the root cause or root opportunities present in your current experience.
  • Missing the opportunity to loop in interdisciplinary perspectives: Often, the connection between business units – especially ones that have overlapping activities related to the customer experience – is where you’ll uncover the greatest opportunities for improvement. Every company has handoffs. It’s important to consider them all.
  • Hinder real discussions from happening between stakeholders: Bringing people together can be massively beneficial. This is an opportunity to create alignment. By bringing teams together to work towards one common goal and share their individual team’s hurdles, your teams will naturally discover micro-solves that can be executed immediately, and contribute to the macro-solution.

Now, to get a revitalized understanding of your business’ performance and efficiency, conduct workshops with internal stakeholders – this can include customer service and sales reps, researchers, customer experience specialists, marketing leads, product owners, designs and more. These service blueprinting workshops should include a few important exercises:


  1. Hypothesize and map out internal interpretation of the customer’s journey. Be sure to identify each phase and define customer interaction points.
  2. Map out the people, process and systems that are in play at each of those key interaction points.
  3. Capture what internal stakeholders say about those key interactions (qualitative). Simple things like definitions of words, or what they want customers to feel after that interaction can all be important in understanding the internal impact on your CX.
  4. Articulate underlying assumptions and beliefs around language commonly used to describe KPIs and company-wide goals. This will help identify and deconstruct misunderstandings between teams and enable a fresh start where everyone is on the same page and working from a consistent understanding.

At the end of the workshop, you should be able to identify each phase in the customer’s experience, who and what they interact with within your organization, and how you meet their needs along the way.


Keep in mind, for some companies, a workshop is all that is needed to gather internal perspective. On the other hand, sometimes workshops are just the starting place and then require deeper dives with specific departments, business units, or individual role types to further precipitate areas where exploration is needed. So, once your workshop is completed, identify whether or not you need to go deeper, and, if so, what types of roles, departments or business units you need to go deeper with.


Continue to conduct stakeholder interviews until you feel confident that you’ve really mapped out the impact those areas have on the internal customer journey or end customer experience.


Need an example? Let’s talk about articulating underlying assumptions. Healthcare organizations often use the word “encounters” as a measurement for improving patient engagement. However, when we’ve asked organizational team members to define the term, no one in the room has the same definition or knows how to explain it. If everyone perceives and defines a goal and/or measurement like “encounters” differently (or in many cases, can’t define it at all), it’s impossible to know how or when to measure and define success. The solution? Get it on paper (or a whiteboard or shared digital document)! When you put something down in writing and rally around a common definition, you can identify optimal procedures to measure it. This will ultimately contribute to agreeance and alignment necessary for not only standing up successful marketing programs, but proving ROI.

If everyone perceives and defines a goal and/or measurement differently (or in many cases, can’t define it at all), it’s impossible to know how or when to measure and define success.

Step 3: Hone in on the end users

Now it’s time to look beyond the internal perspective and focus the lens on your customers. This requires the most time and could take anywhere from a couple weeks to a couple years to complete, depending on your scope.


Before you get start, there are a few tips to consider that will help you avoid common pitfalls at this stage:


  • Ensure you get to the real root cause of pain or opportunity and don’t get caught in optimizing for the surface level. As with other phases, this requires that you push beyond the surface of what users tell you qualitatively. A great way to do this, no matter what process you use, is to ask “Why?” three to five times. Once a user shares an observation that seems important, ask why. Then ask why again, and again. Many companies gather initial observations and never get to the true root cause, therefore they’re stuck treating only symptoms of problems.
  • Don’t rest on qualitative data. Instead, pair it with quantitative data. Find ways to objectively measure what is happening to your user’s experience at key milestones throughout the journey. We often do this by merging qualitative data with surveys or other analytical data (think customer CRMs, google analytics, website data, or MPS data).
  • Avoid intuition as your primary method of gathering user experience. Qualitative techniques we often employ include interviews, focus groups and ride alongs.
  • Give yourself time to really hone in on the user experience. Many companies never gather this information, at all; instead, they architect their journey based on internal perspective and move forward. It’s always important and useful to get real, quality feedback from end users.
  • Don’t forget that your customer base is diverse. Get feedback from multiple personas as you go.

Also read: Qualitative vs. Quantitative Data in CX Design: Everything You Need to Know


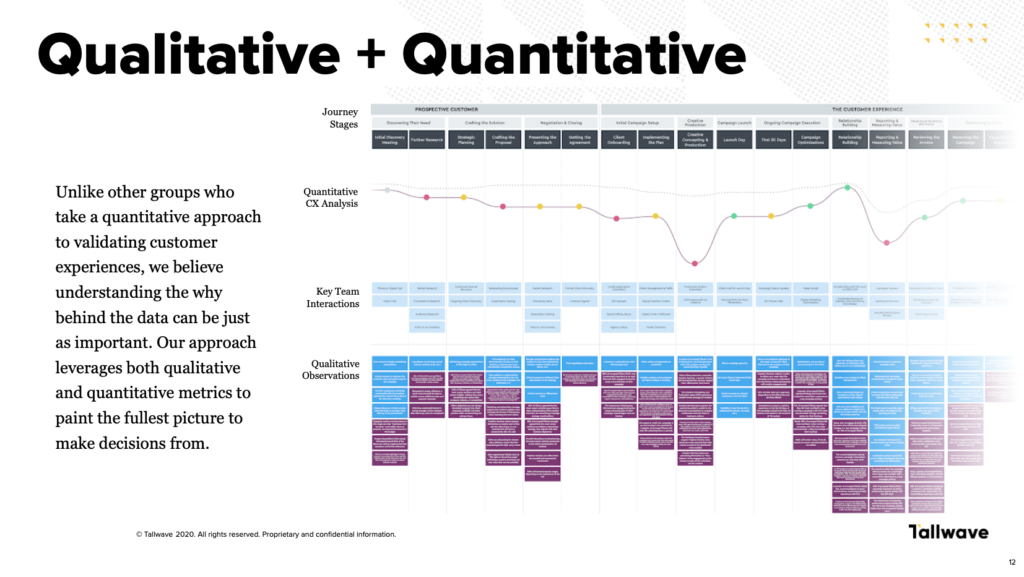
During this phase, you and your team should use qualitative and quantitative techniques (learn more about that here) to obtain real customer feedback by guiding them through each phase of the outlined journey to validate their needs, wants, and experiences. 0 By sitting down with real customers, you’re able to explore their goals and needs respective to your product, services, and/or digital presence. In the end, you’ll be able to expose valuable insights that can drive future focus. Often, this phase identifies opportunities for re-engagement. While your goals may be more specific, it is still important to see the full picture before drawing any conclusions about your overall customer experience. At this stage, compiling as much information as possible is key.


Need an example? Sometimes this phase can give rise to specific problems, including the root cause of customer conversions. One of our clients – a leading nation-wide insurer group of automobiles, homes and small businesses – was seeing a dip in quote yields and overall conversion rates. After doing a deep data dive – using both qualitative and quantitative techniques – we discovered the majority of drop offs were occurring moments before clicking the, “I’m ready to complete my quote” button. Why would users go through the trouble of filling out 99% of the form, only to abandon the process right before getting the information they originally sought? The answer was buried in the messaging.


Qualitative & Quantitative Data Gather | Tallwave

By speaking to customers, we discovered the last question in their quote-request form – one that asked the user if they’d like to enter information to receive additional insurance quotes – was causing feelings of exhaustion and frustration for potential customers. Instead of marking “No,” and continuing on, they simply bounced away from the site – and, likely, with no intention to return. This not only illuminated the main pain point, but allowed us to execute focused competitive analyses to get inspiration from competitors, develop potential solutions, test them, and then launch the solution/s to the market.

Step 4: Review, analyze, and map it out

It’s time to start putting the puzzle pieces together.


With an integrated team spanning a variety of disciplines (including research, business innovation, experience design, and consulting), review the customers’ experience data from every angle. Doing this will provide a more holistic view necessary for creating a more robust and useful map.


Conduct another workshop to synthesize and compare data from internal and external perspectives on your customer experience.


Starting with the qualitative data, use tools like an an affinity map to clearly identify where your customers’ needs are being met – and where they’re not. This should expose service gaps and highlight opportunities.


Next, test the customer feedback against the internal perspectives map previously created. More often than not, it will reveal discrepancies between what internal teams believe is important, versus what customers really assign value to. This visual approach, while also displaying challenges within the current experience, will make achieving cross-functional alignment around future plans easier.


Also read: Crafting Employee Experiences to Improve Customer Experiences


Keep in mind that the ultimate goal is continual evolution. Take the time to test and, as you do, update your journey map.

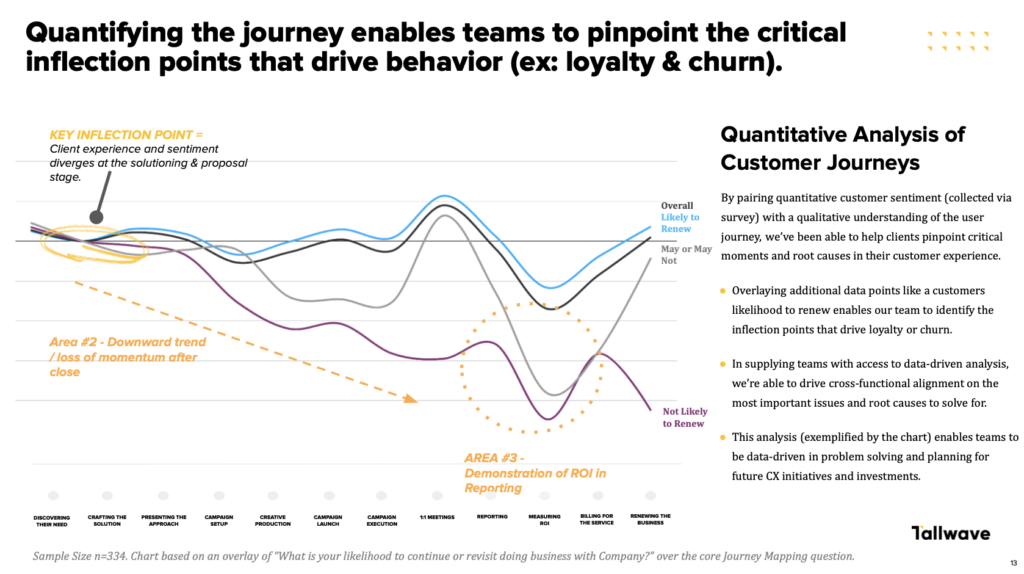
Lastly, to pinpoint exact moments of friction and/or leverage in your customer experience, pair the quantitative data – which analyzes customer sentiment and perspective at every stage and interaction – with your new qualitative understanding of the user experience. By overlaying these data points – like a customer’s likelihood to renew – you’ll be able to pinpoint specific moments that drive loyalty or churn and their financial impacts.


At this point, now all that’s left is to prioritize the areas of opportunity and roadmap short- and long-term focuses to improve business workflow. Keep in mind that the ultimate goal is continual evolution. Take the time to conduct ongoing testing and, as you do, update your experience map.


Need an example? A major broadband communications company who had been in the business of delivering entertainment and connection companies and companions long before the internet existed was struggling with gradual increases of customer dissatisfaction and churn. Month over month, the company’s acquisition and retention numbers decreased. Thei business and market share was at risk. By pairing quantitative sentiment with our qualitative understanding and visually mapping both, we were able to pinpoint the main points of friction that we needed to solve for: Severe client and market variability, inconsistent structure and resources a reactive servicing model, disparate systems and processes, a need for continued product training, and shifting client expectations. To summarize, the experience being delivered was afflicted with challenges and creating volatility throughout the journey, ultimately contributing to churn.


Qualitative Analysis of Customer Journey | Tallwave

By outlining the specific issues, we were able to build a path forward to develop a proactive and consultative CX that focused on the most essential needs, including:

  • Elevating the customer care solution to create a repeatable experience that promotes consistency while preserving autonomy
  • Simplifying the employee experience to reduce friction by streamlining backend systems and processes
  • Modernizing client interactions with omnichannel and digital-forward experience
  • Invest in delivering an experience that is predictably proactive and drives consultative value
  • Clearly demonstrating the ongoing value of partnering with a customer care solution

Pinpointing the needs and developing solutions enabled us to become part of the client’s strategy, not just a one-off tractic. Next, we built a roadmap that encompassed recommended initiatives, identified workstreams, defined what success would look like and outlined how the work would enable continual program evolution.

The Bottom Line

By consistently completing the customer experience mapping exercise (don’t set it and forget it!), you can empower your team to problem solve from a data-driven perspective and establish plans for future CX initiatives and investments.

At the end of the day, customer experience mapping is about connecting with your customer, and deeply understanding and empathizing with their needs and wants. If your company can prioritize solving customer’s problems as the world evolves, you’ll set yourself up for unstoppable momentum.

Play Video

Bunger Steel

Doing some things and making some impacts